SotaOG is an analytics platform for oil and gas operators. Their data lived in SCADA screens, paper tank tickets and separate finance systems. I designed the layer that brings it together into one view a team can act on.
Role
Lead Product Designer, founding designer
Team
Product, Strategy, Growth
When
February 2022 to April 2023
Status
Shipped
−64%
Dashboard task time
8.3 to 3 minutes
+52%
Task completion efficiency
across core workflows
−37.2%
Reconciliation time
for tank tickets
2 more industries, manufacturing and ESG, later adopted the platform.
The problem
Oil and gas teams run on real-time accuracy. Their data was static, scattered and partly on paper.
Decisions were delayed and anomalies were missed.
Reconciling tickets by hand leaked revenue.
It was hard to see how production had behaved over months.
SCADA is the supervisory software that monitors field equipment. Operators know it deeply, so the aim was to build on that familiarity, not replace it.
My role
End-to-end UX, information architecture and data visualisation.
The 3D digital twin, modelled in Blender and built with Three.js.
Workshops with the CEO, petroleum engineers and finance leads.
A small, enterprise-ready design system.
Mentoring junior designers, and keeping design aligned with engineering, data and the business.
Principles
Speed of understanding matters more than speed of clicking.
Summarise first, reveal detail on demand.
Keep what operators already know from SCADA.
Order every screen by the operator’s workflow.
Design logic
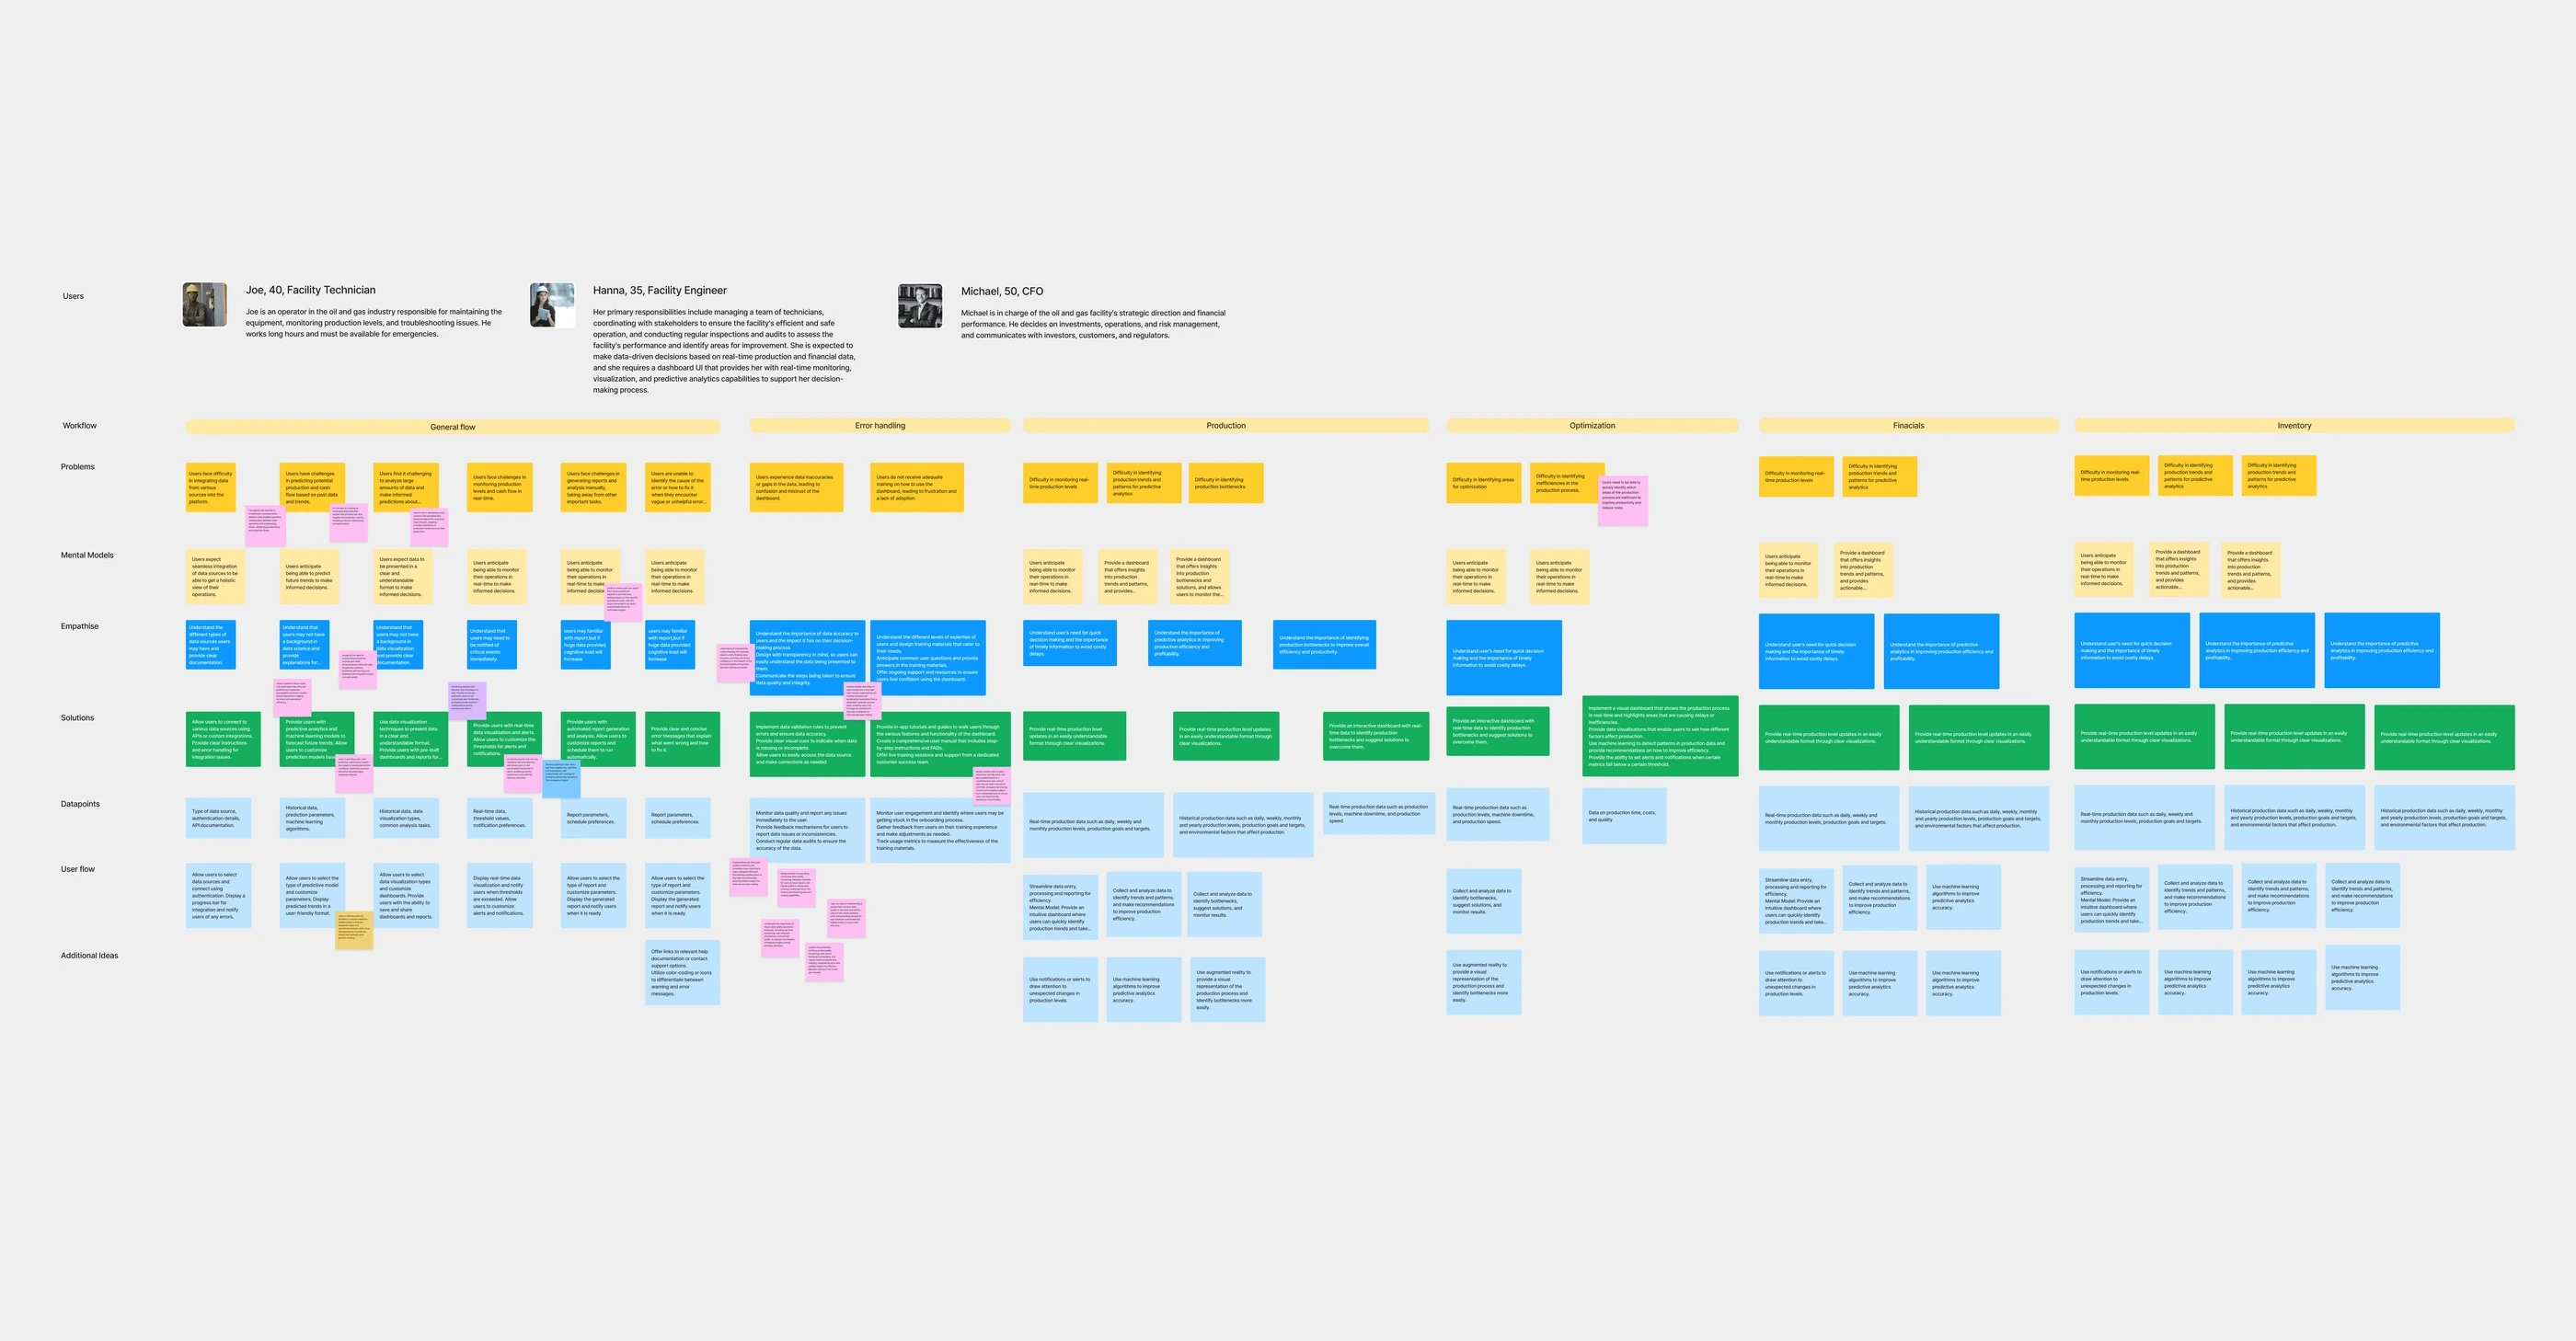
Mapping the operator’s path through the data
Four solutions
1 of 4
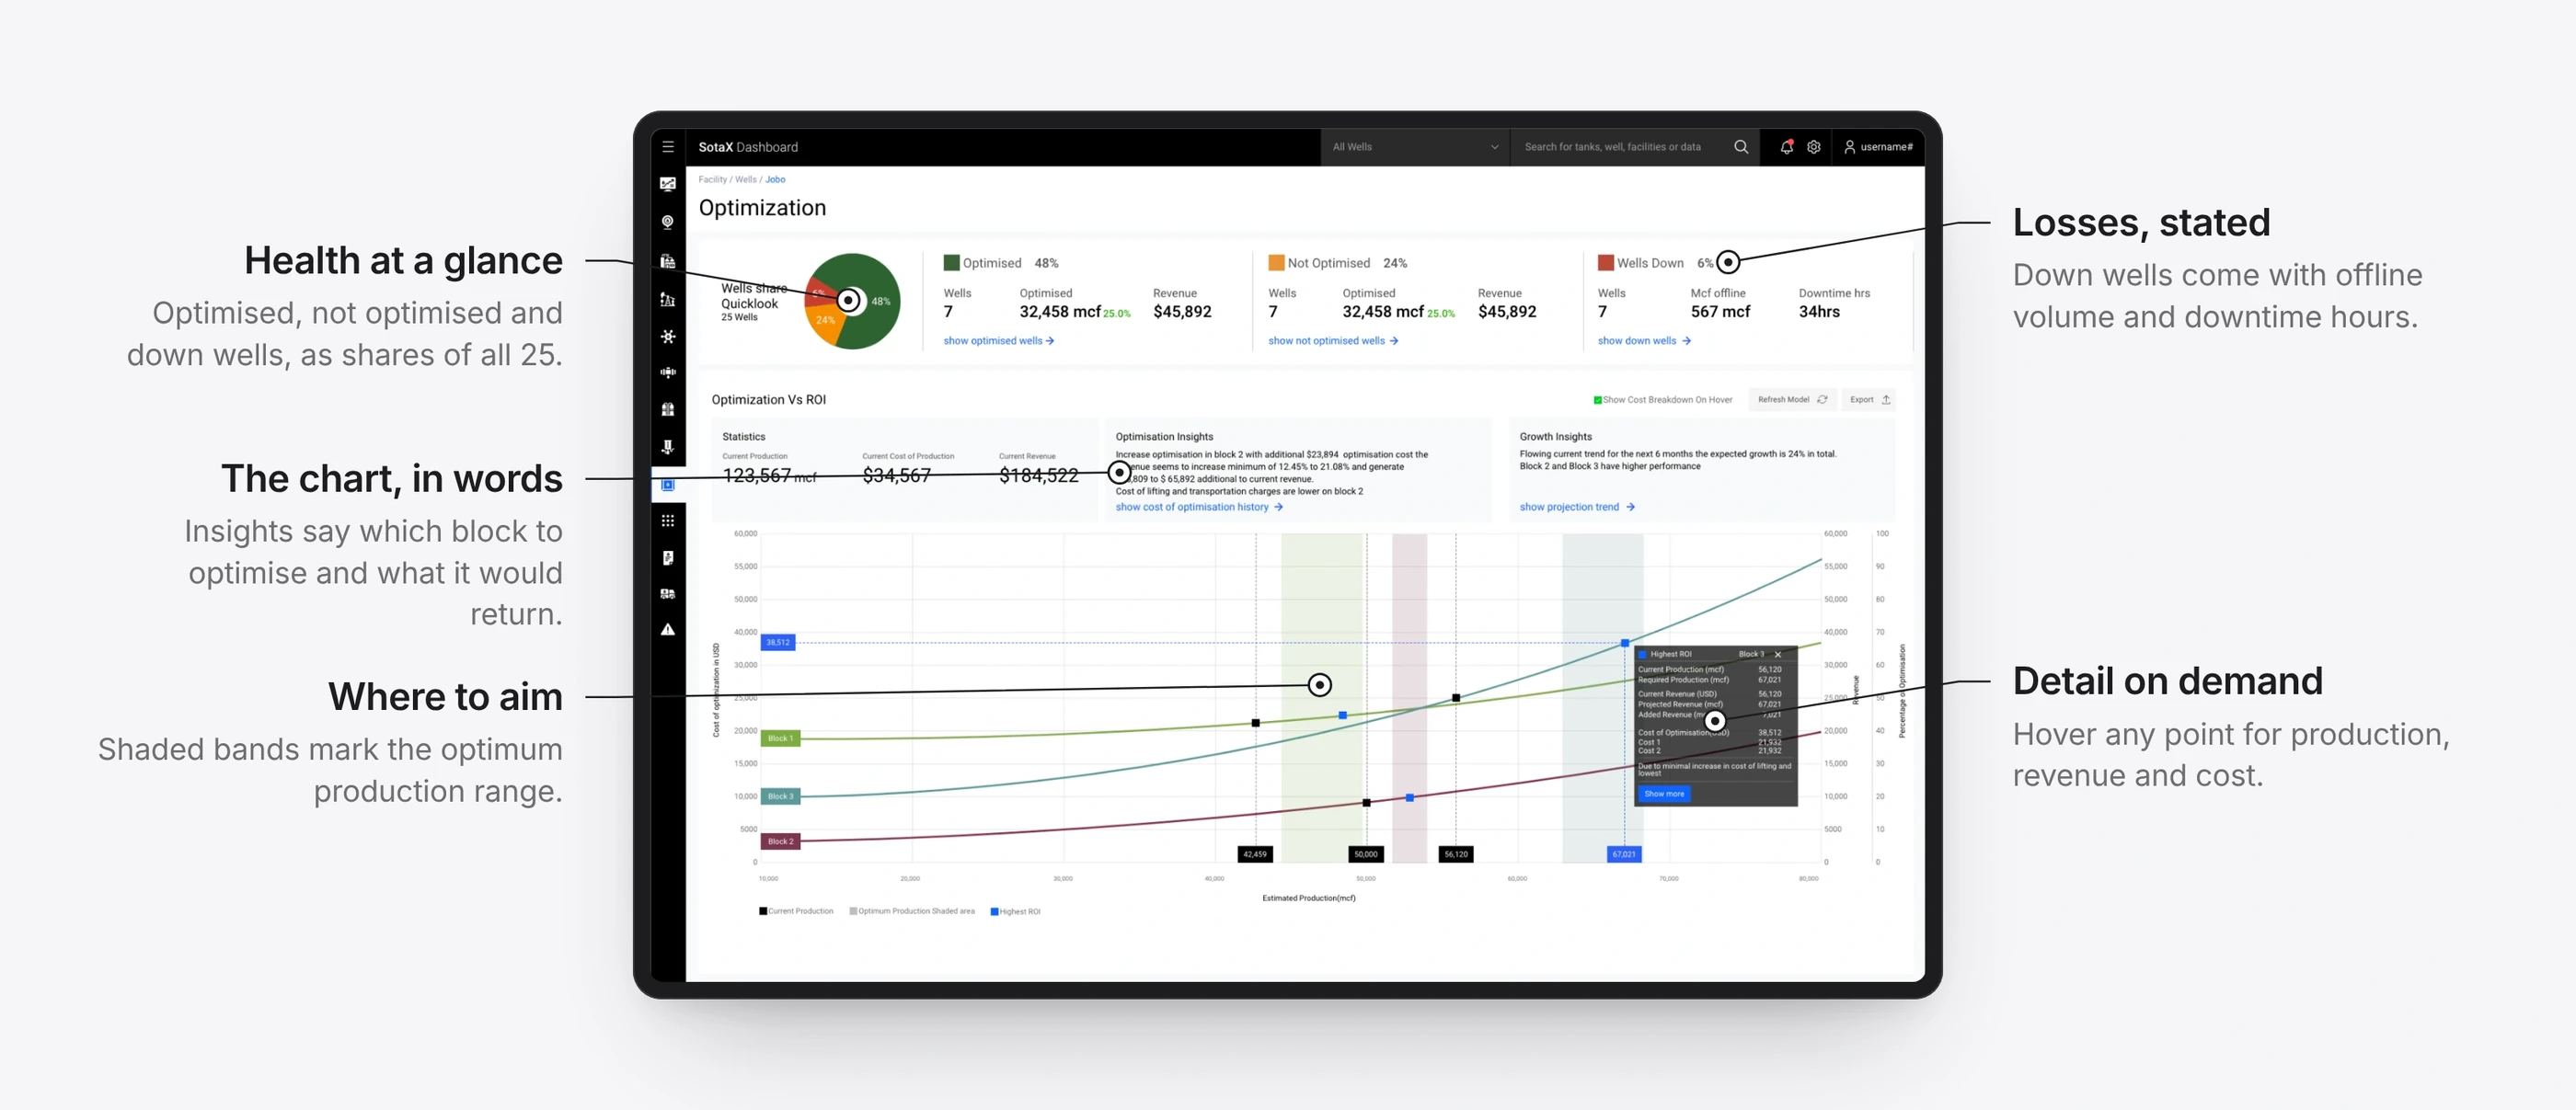
A dashboard that says what changed
BeforePeople couldn’t quickly read how production was behaving, or where attention was needed.
ChangeData grouped by relevance instead of the raw SCADA hierarchy. Every view answers the same three questions in order: what changed, why, and what to do next.
ResultFaster interpretation, and quicker team response.
2 of 4
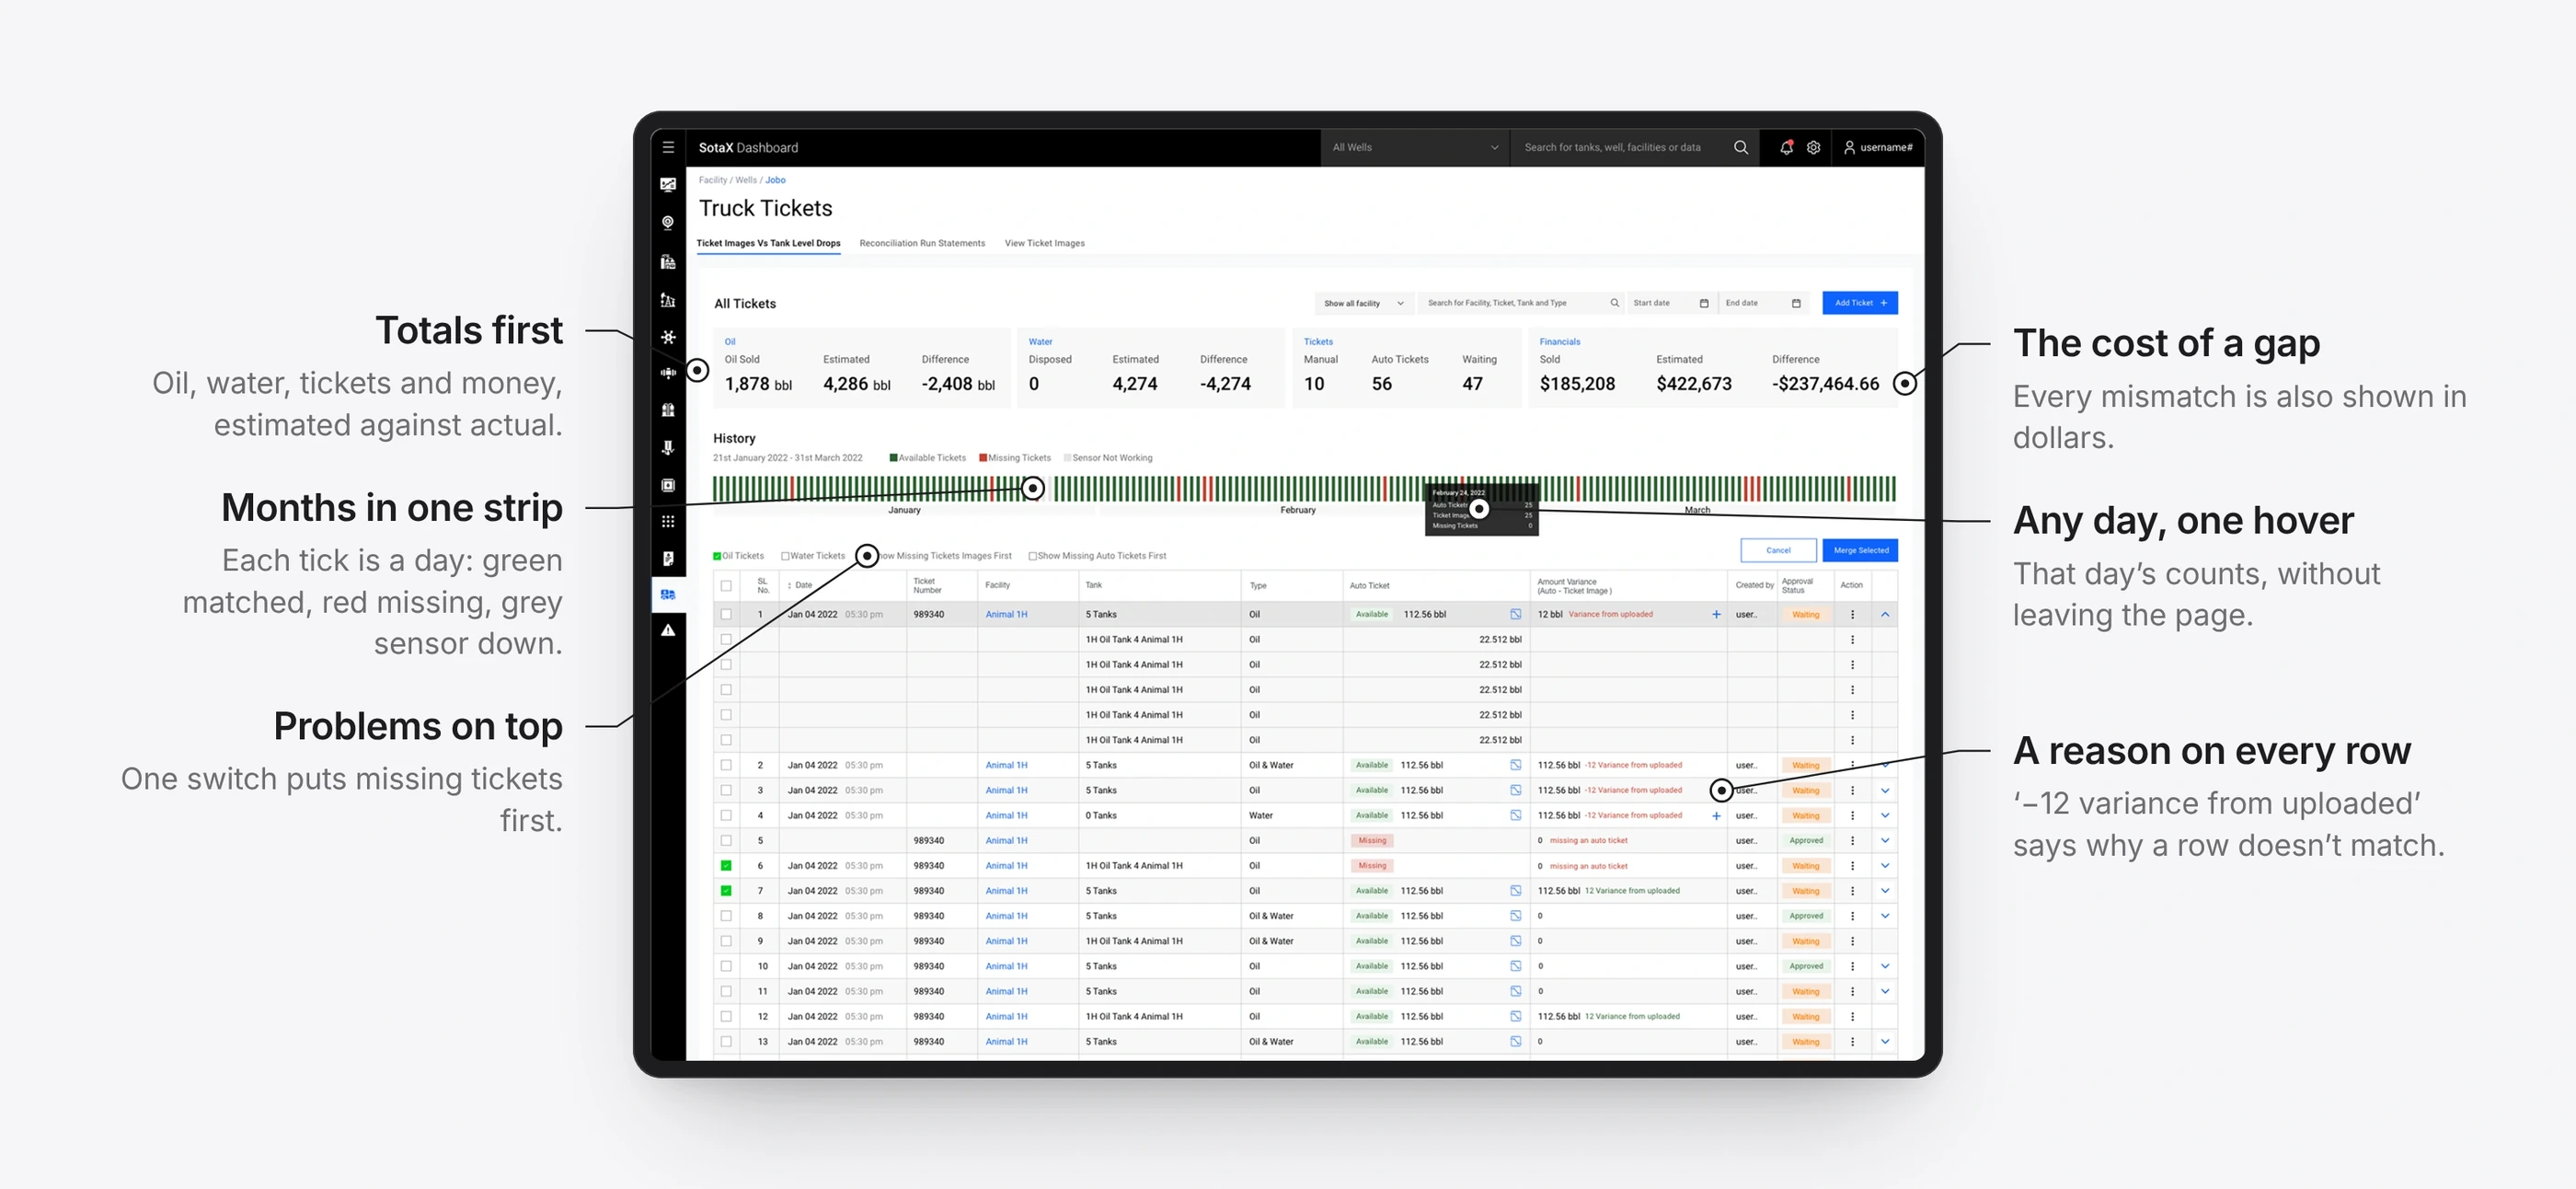
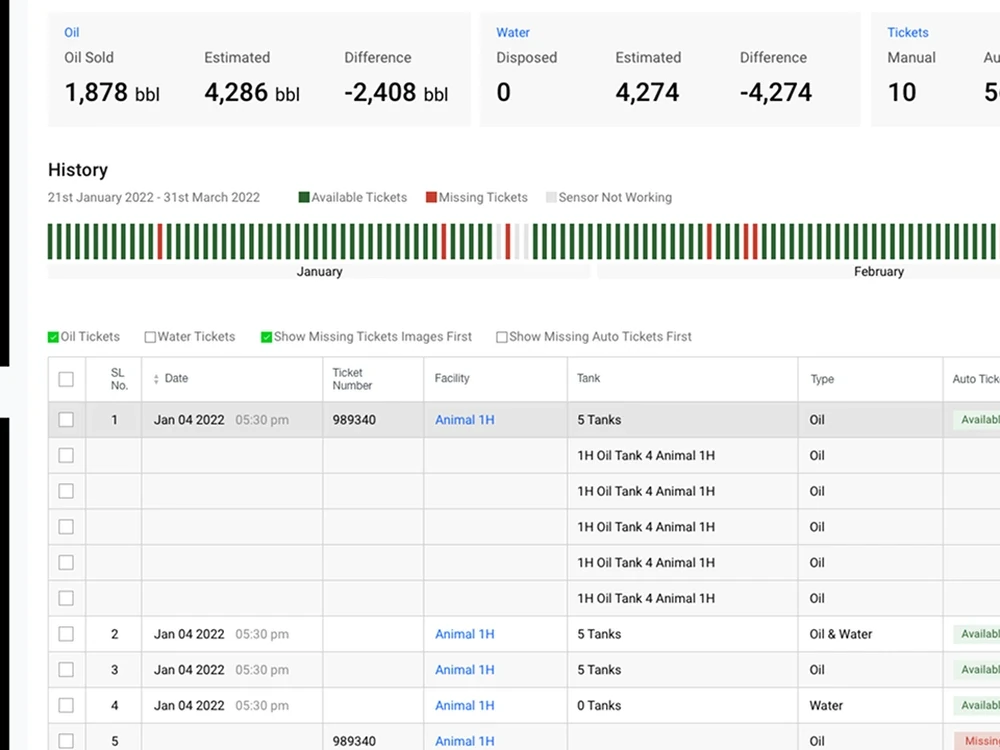
The History Bar
BeforeThousands of sensor readings made mismatches and production drops almost impossible to spot by hand.
ChangeOne scrollable strip compresses months of data. Colour marks each day as matched, missing, in error or a sensor fault, and any day opens into its detail.
ResultMismatched days are spotted at a glance, not found by sorting.
3 of 4
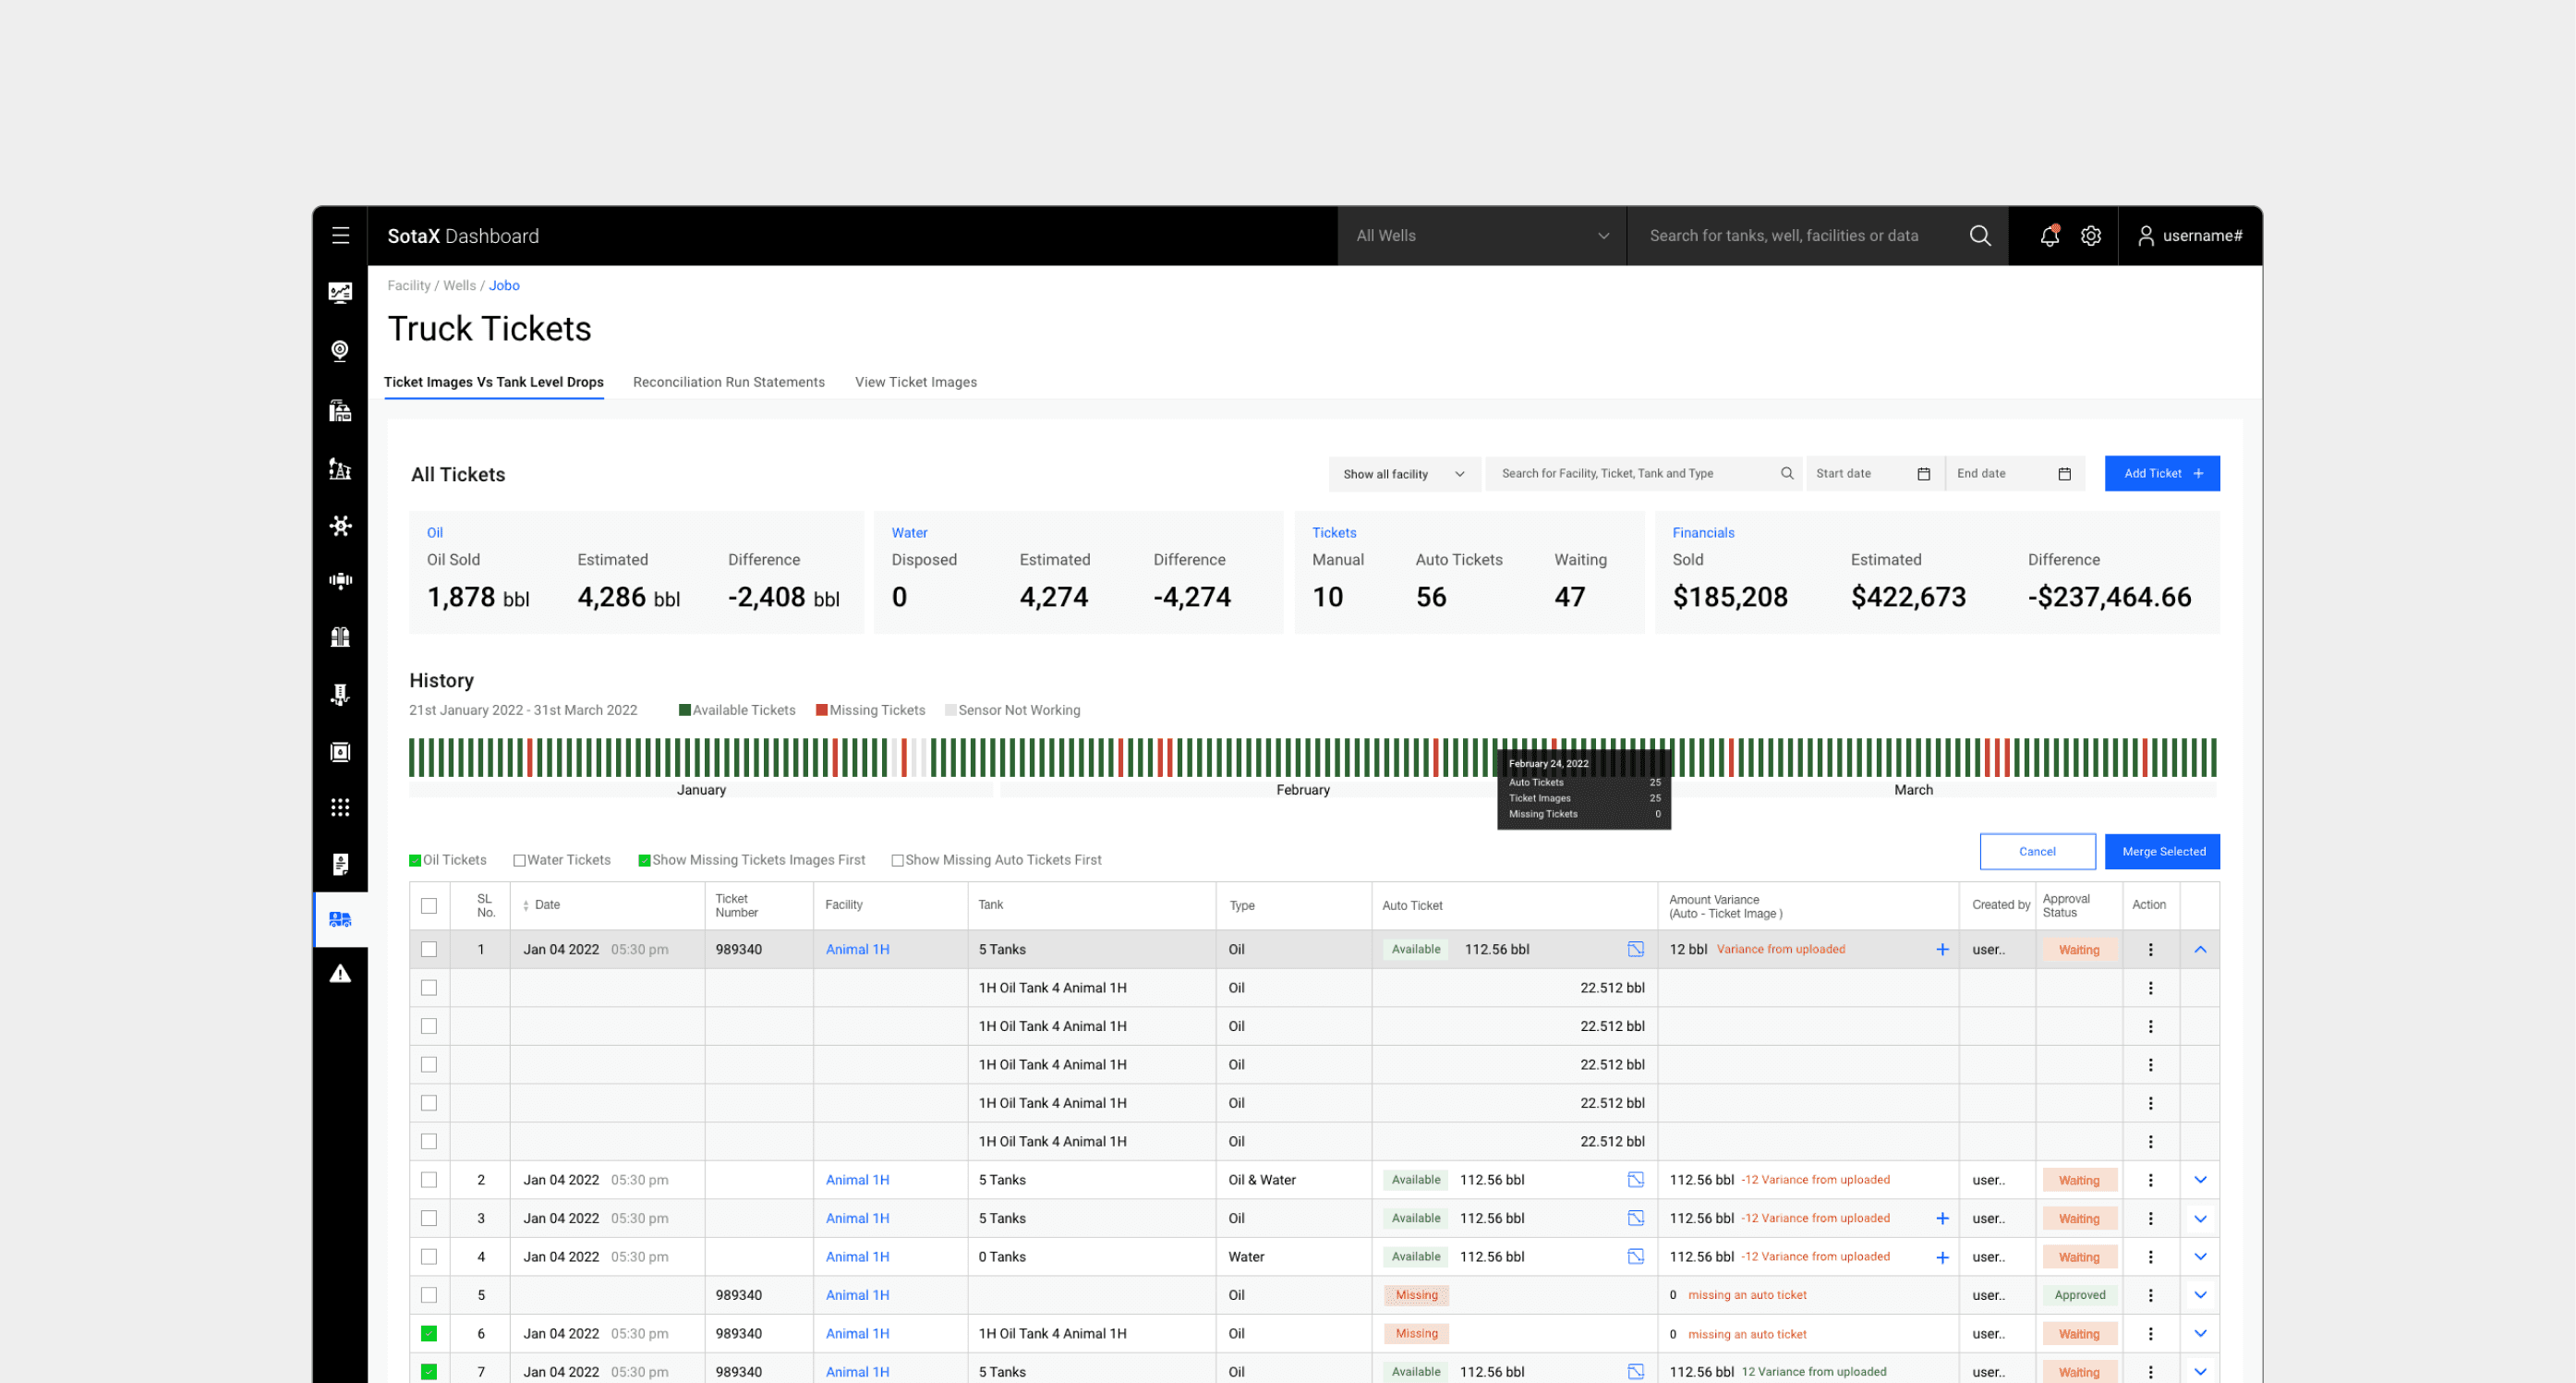
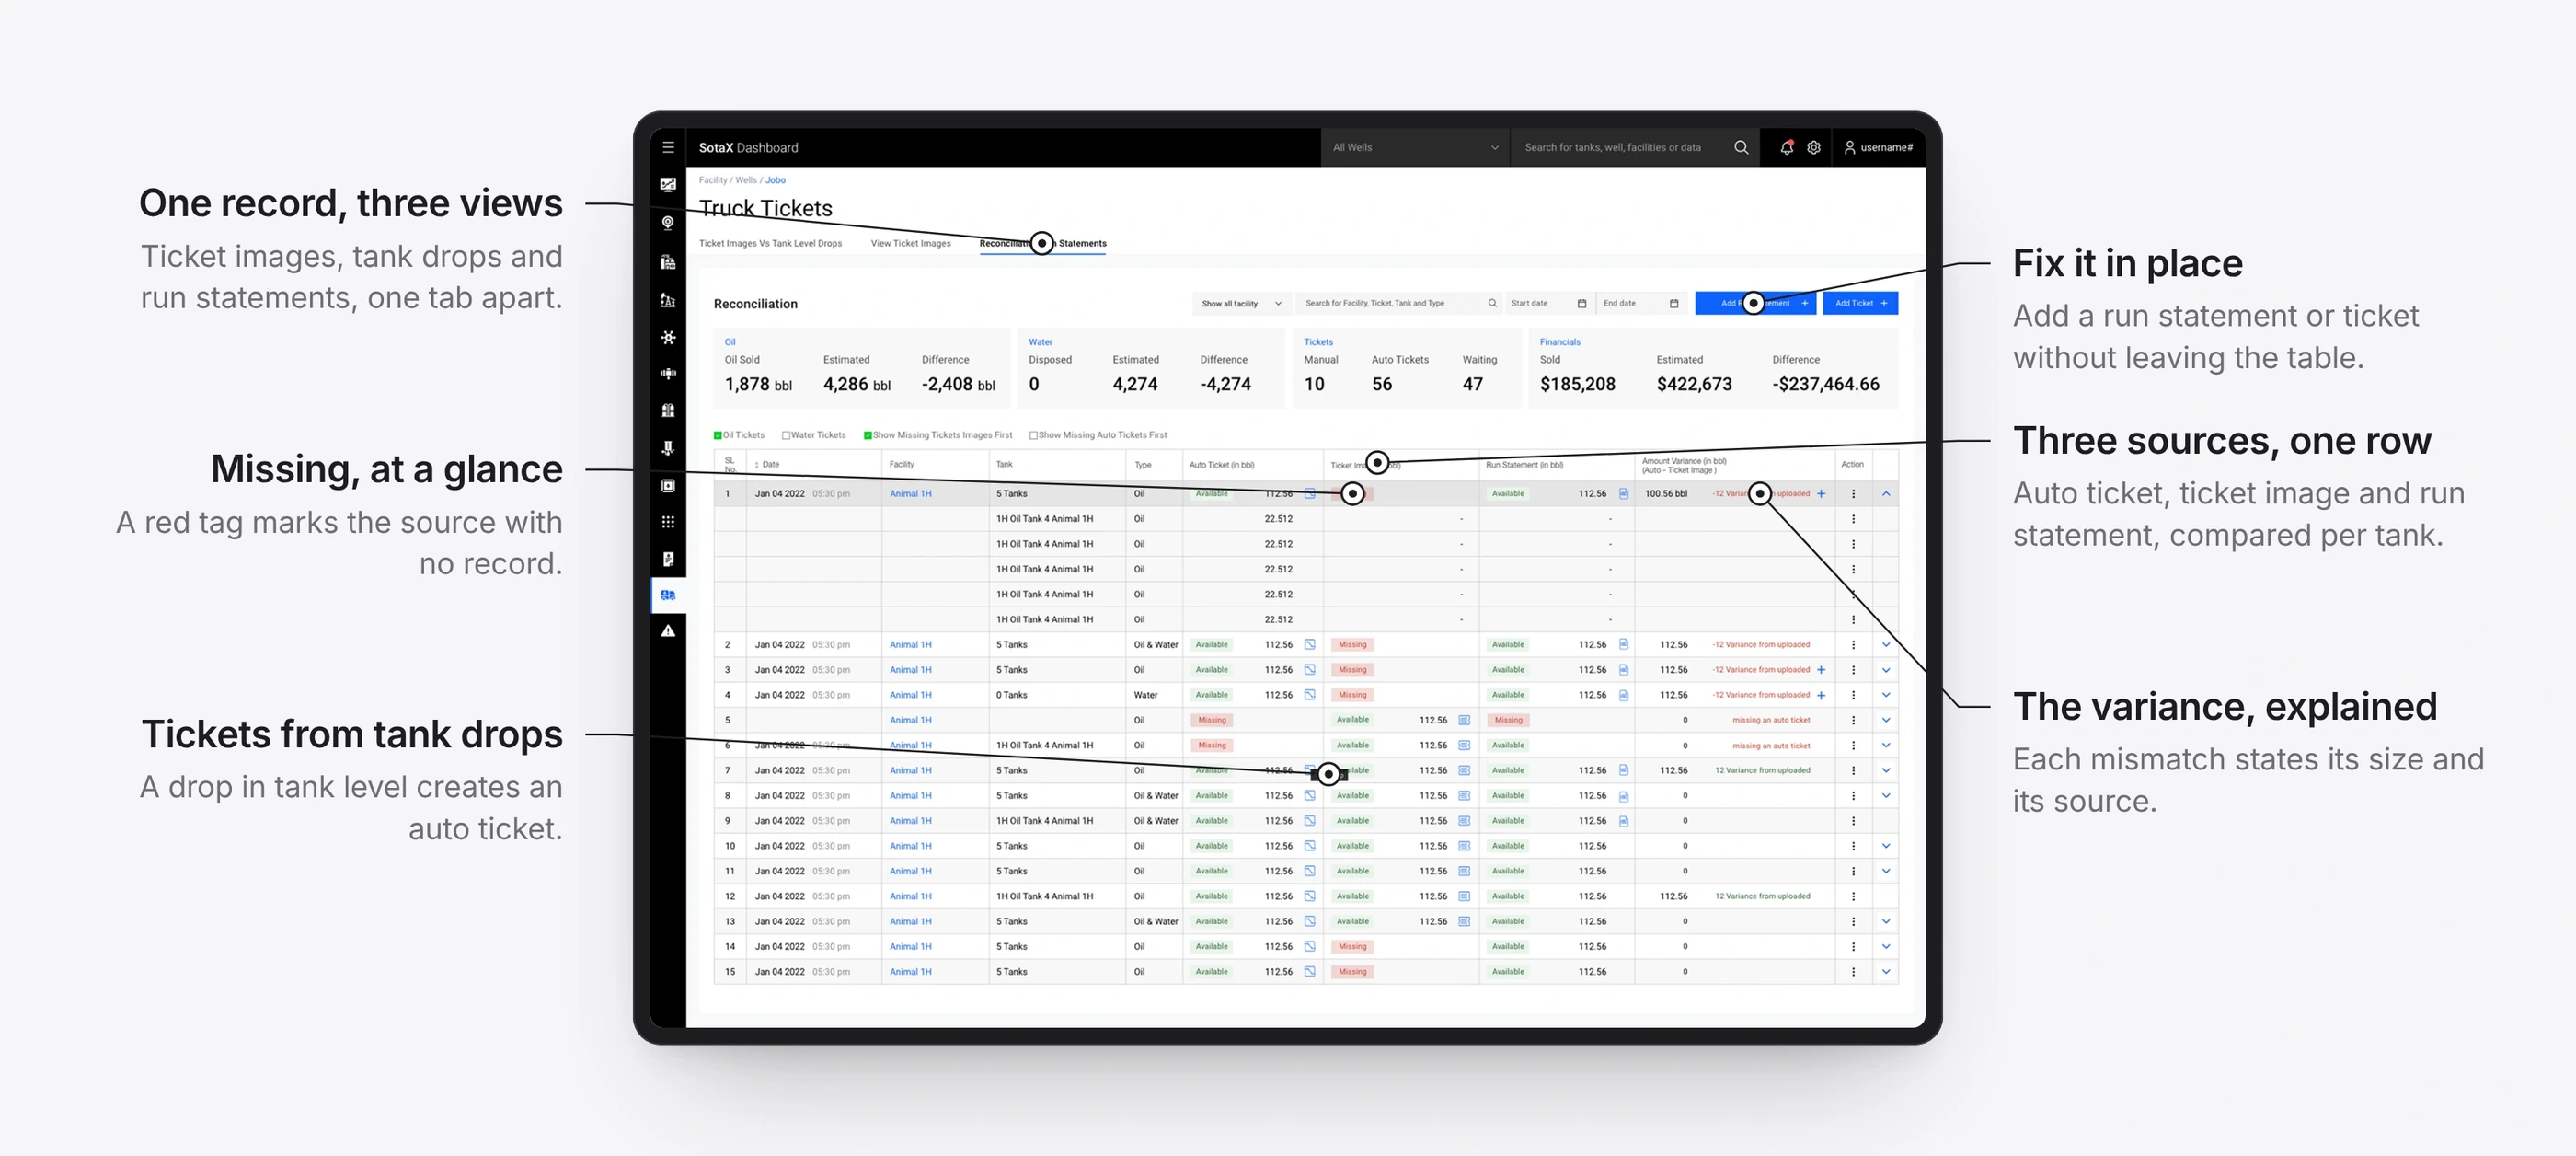
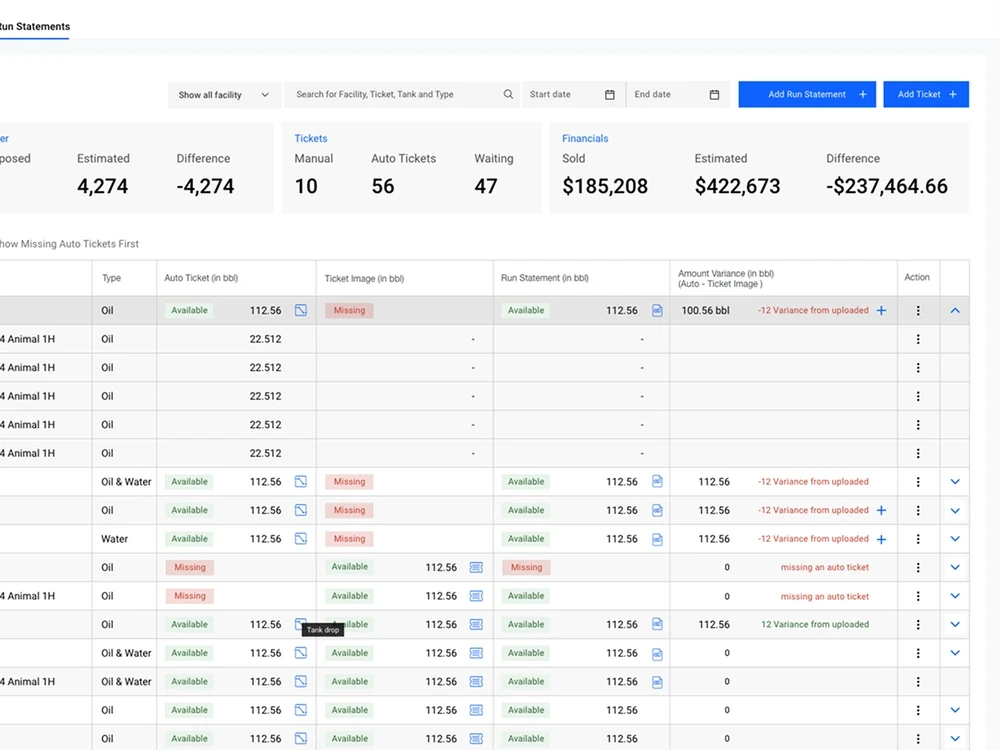
Tickets that reconcile themselves
BeforeMatching tank tickets to run statements by hand was slow and financially risky, especially when tickets were lost or illegible.
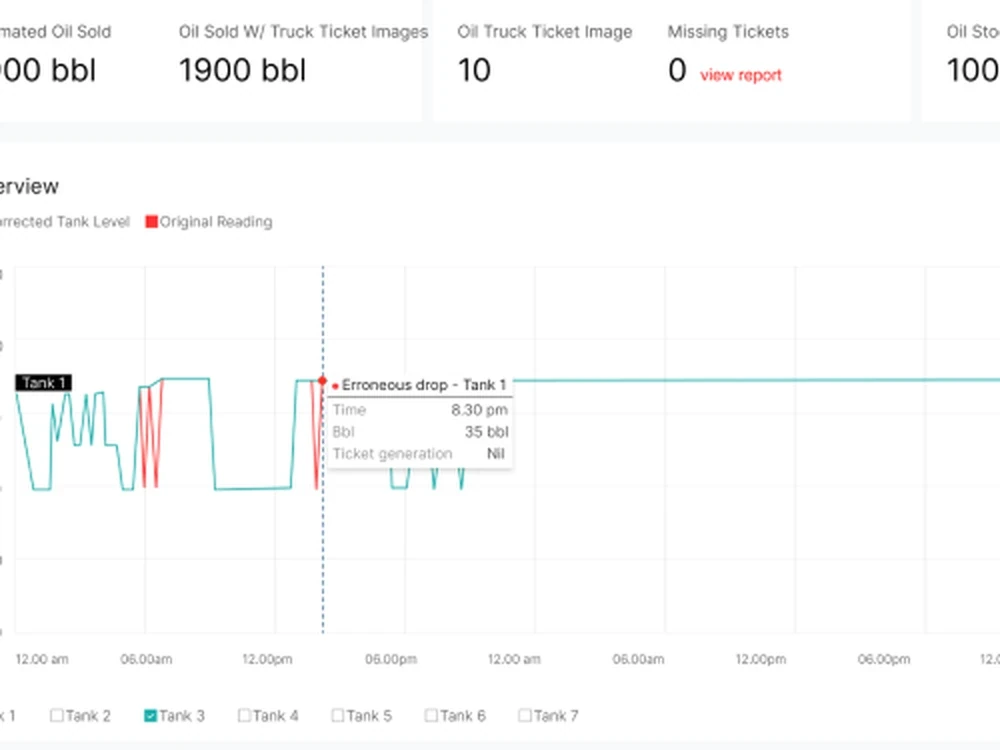
ChangeTickets are read with OCR and matched against run statements and sensor readings. A drop in tank level now creates an auto ticket on its own, and bad readings are flagged instead of billed. Mismatches are fixed in the table, and everything stays searchable.
ResultReconciliation time down 37.2%, and payments for thousands of barrels that had been missed were reconciled once auto tickets went live.
Three sources, compared on one row.
Auto tickets, created from tank drops.
1 / 2
4 of 4
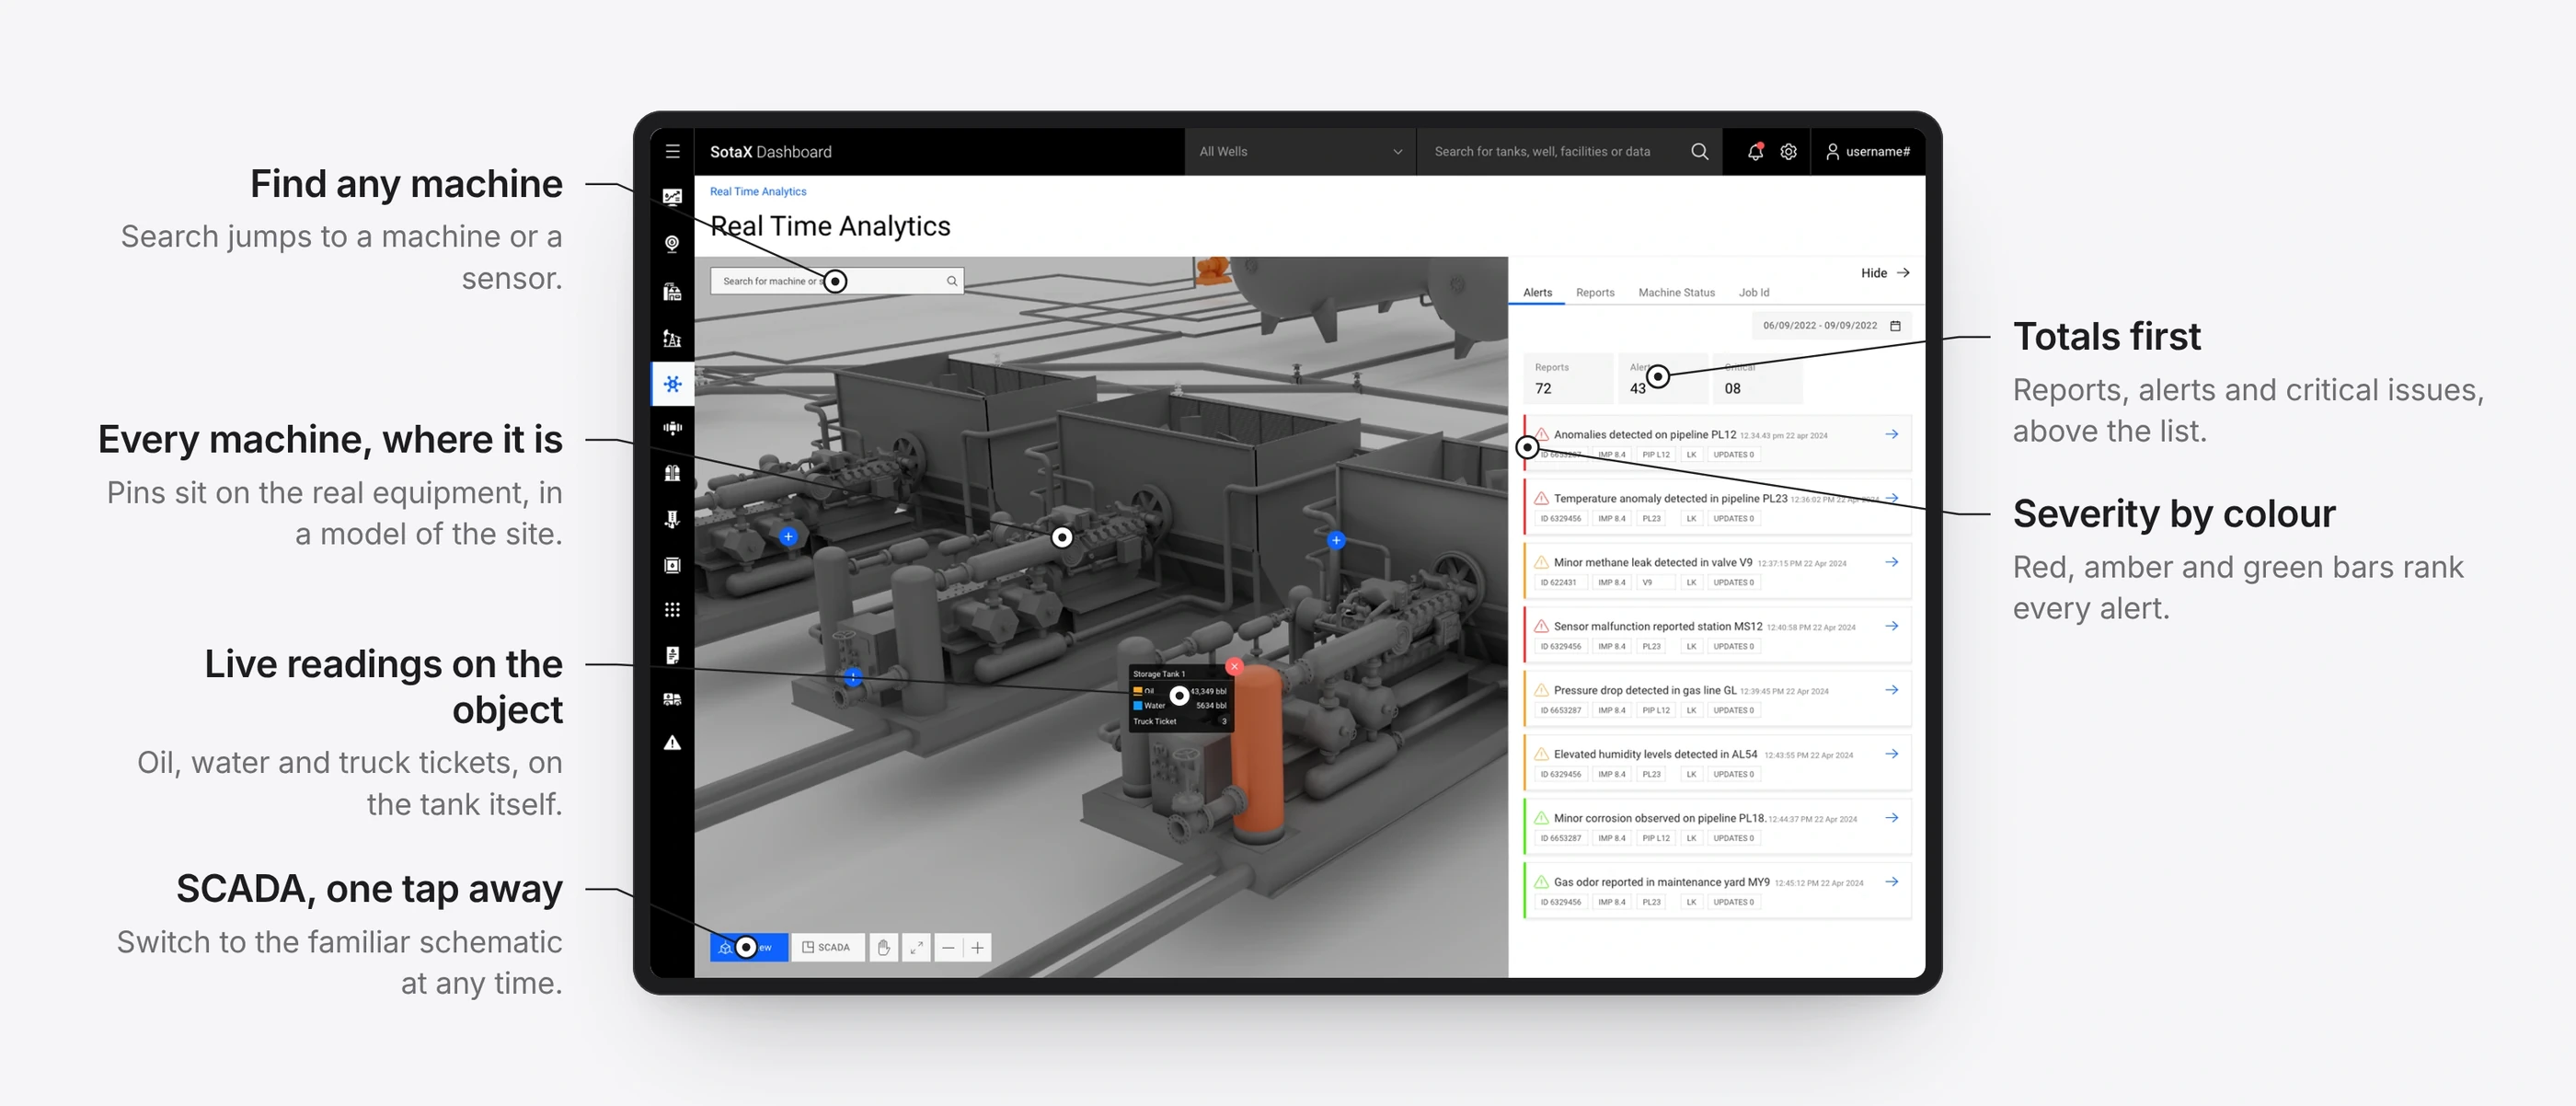
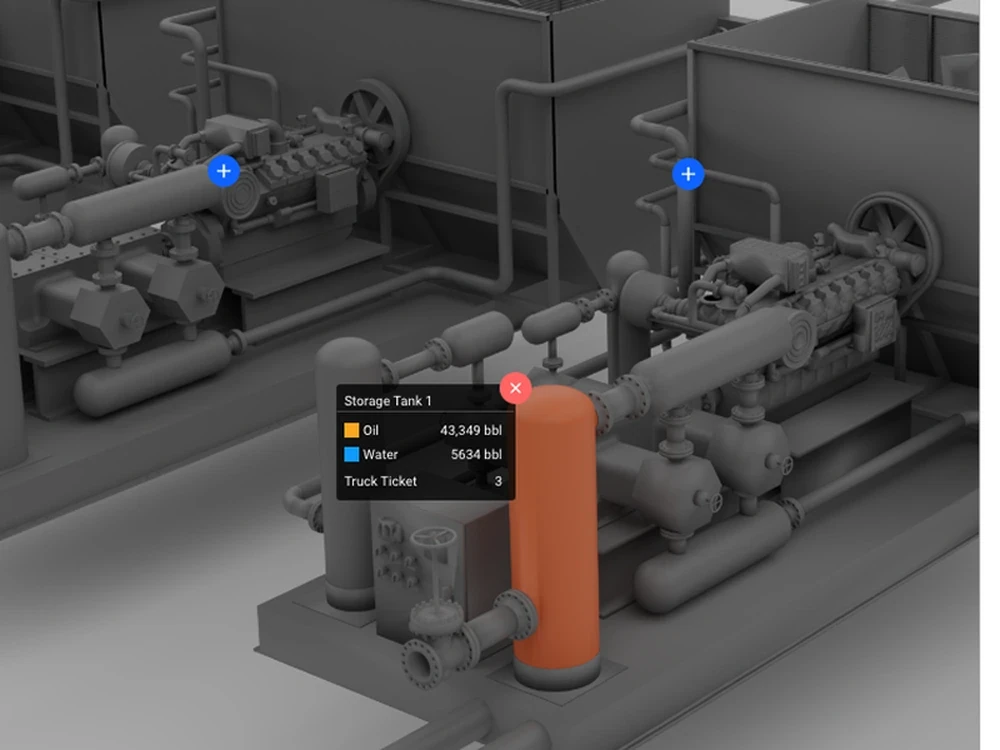
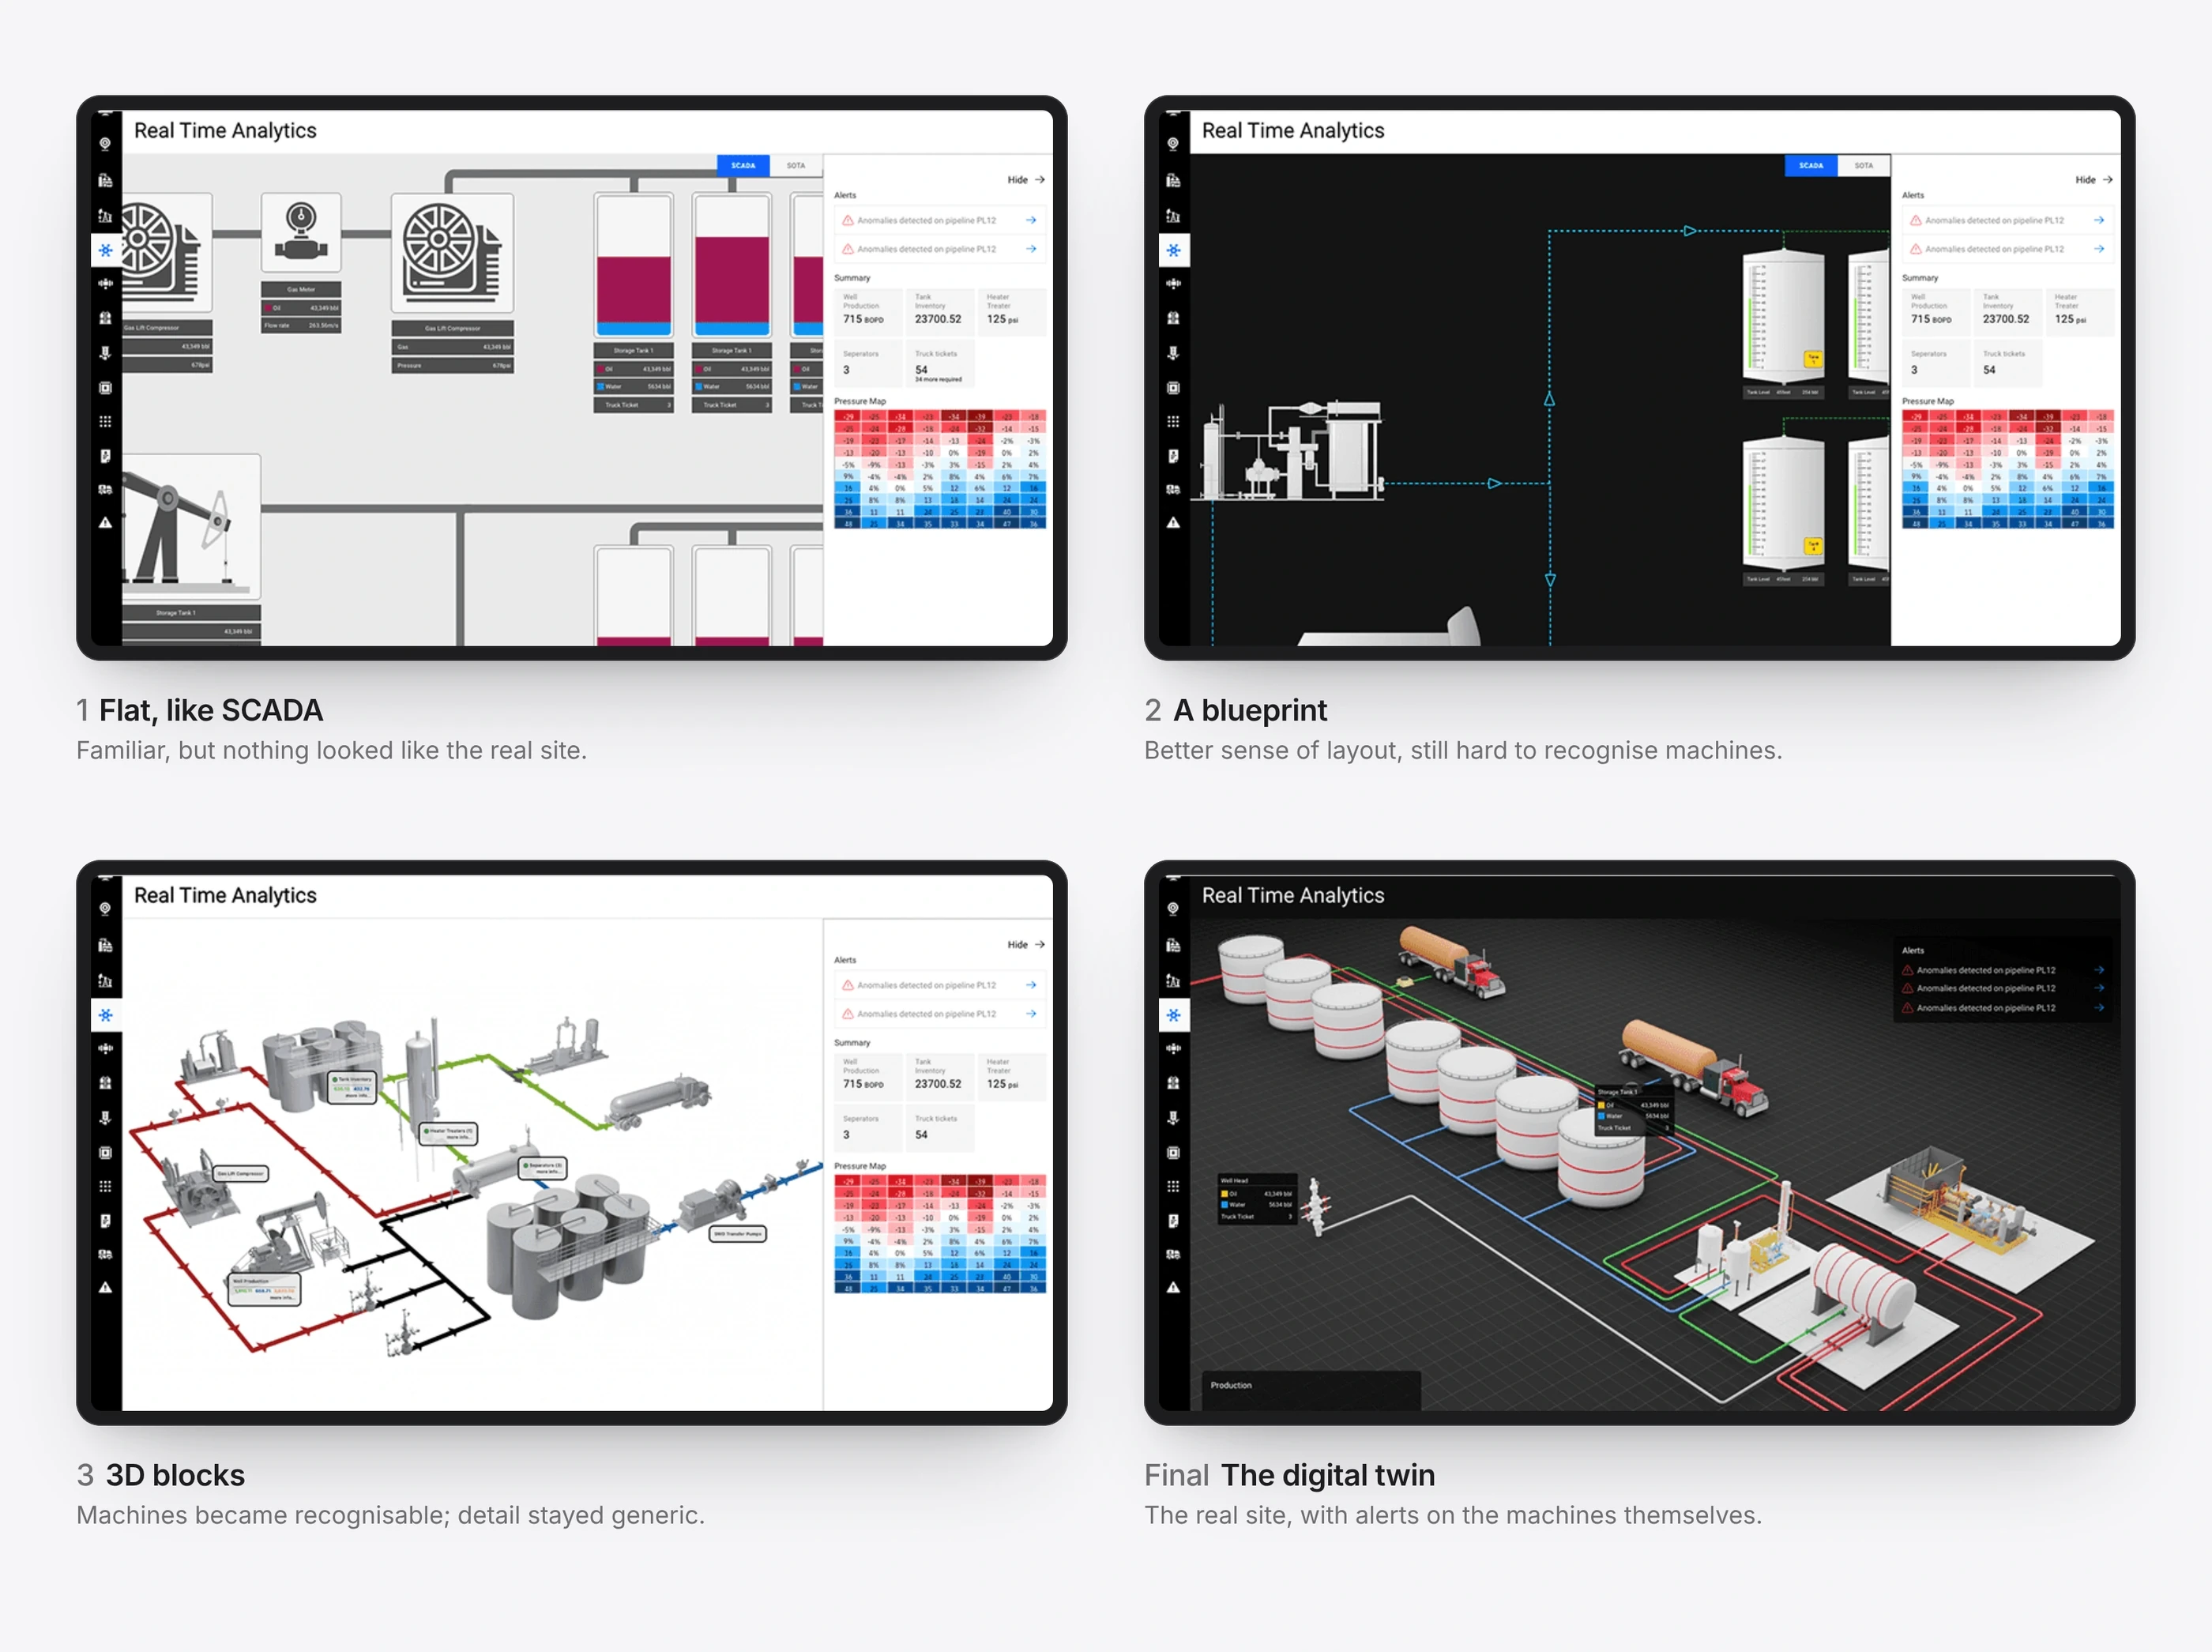
A digital twin of the facility
BeforeSCADA diagrams have no sense of space, which made troubleshooting slow.
ChangeA 3D model of the facility with live data on equipment and valves, colour-coded alerts for flow problems, faulty sensors and low tanks, and drill-down into any sensor.
ResultEngineers preferred it to static SCADA panels, and found faults faster.
One missing ticket, end to end
Every feature on its own looks like a dashboard. The value shows when you follow one problem through the team. This is a composite journey, built from our workshops with operators, petroleum engineers and finance leads: a single tank ticket that never arrived.
1
Operations manager
Is anything wrong today?
Before
Log in to SCADA, export to a spreadsheet, scan the rows.
With SotaOG
Well health and the revenue at stake on one screen, with insights saying where to look.
2
Revenue accountant
Which days don’t match?
Before
Sort and filter thousands of ticket rows, hoping the gap shows.
With SotaOG
The History Bar marks every missing day across months. One switch puts the problems first.
3
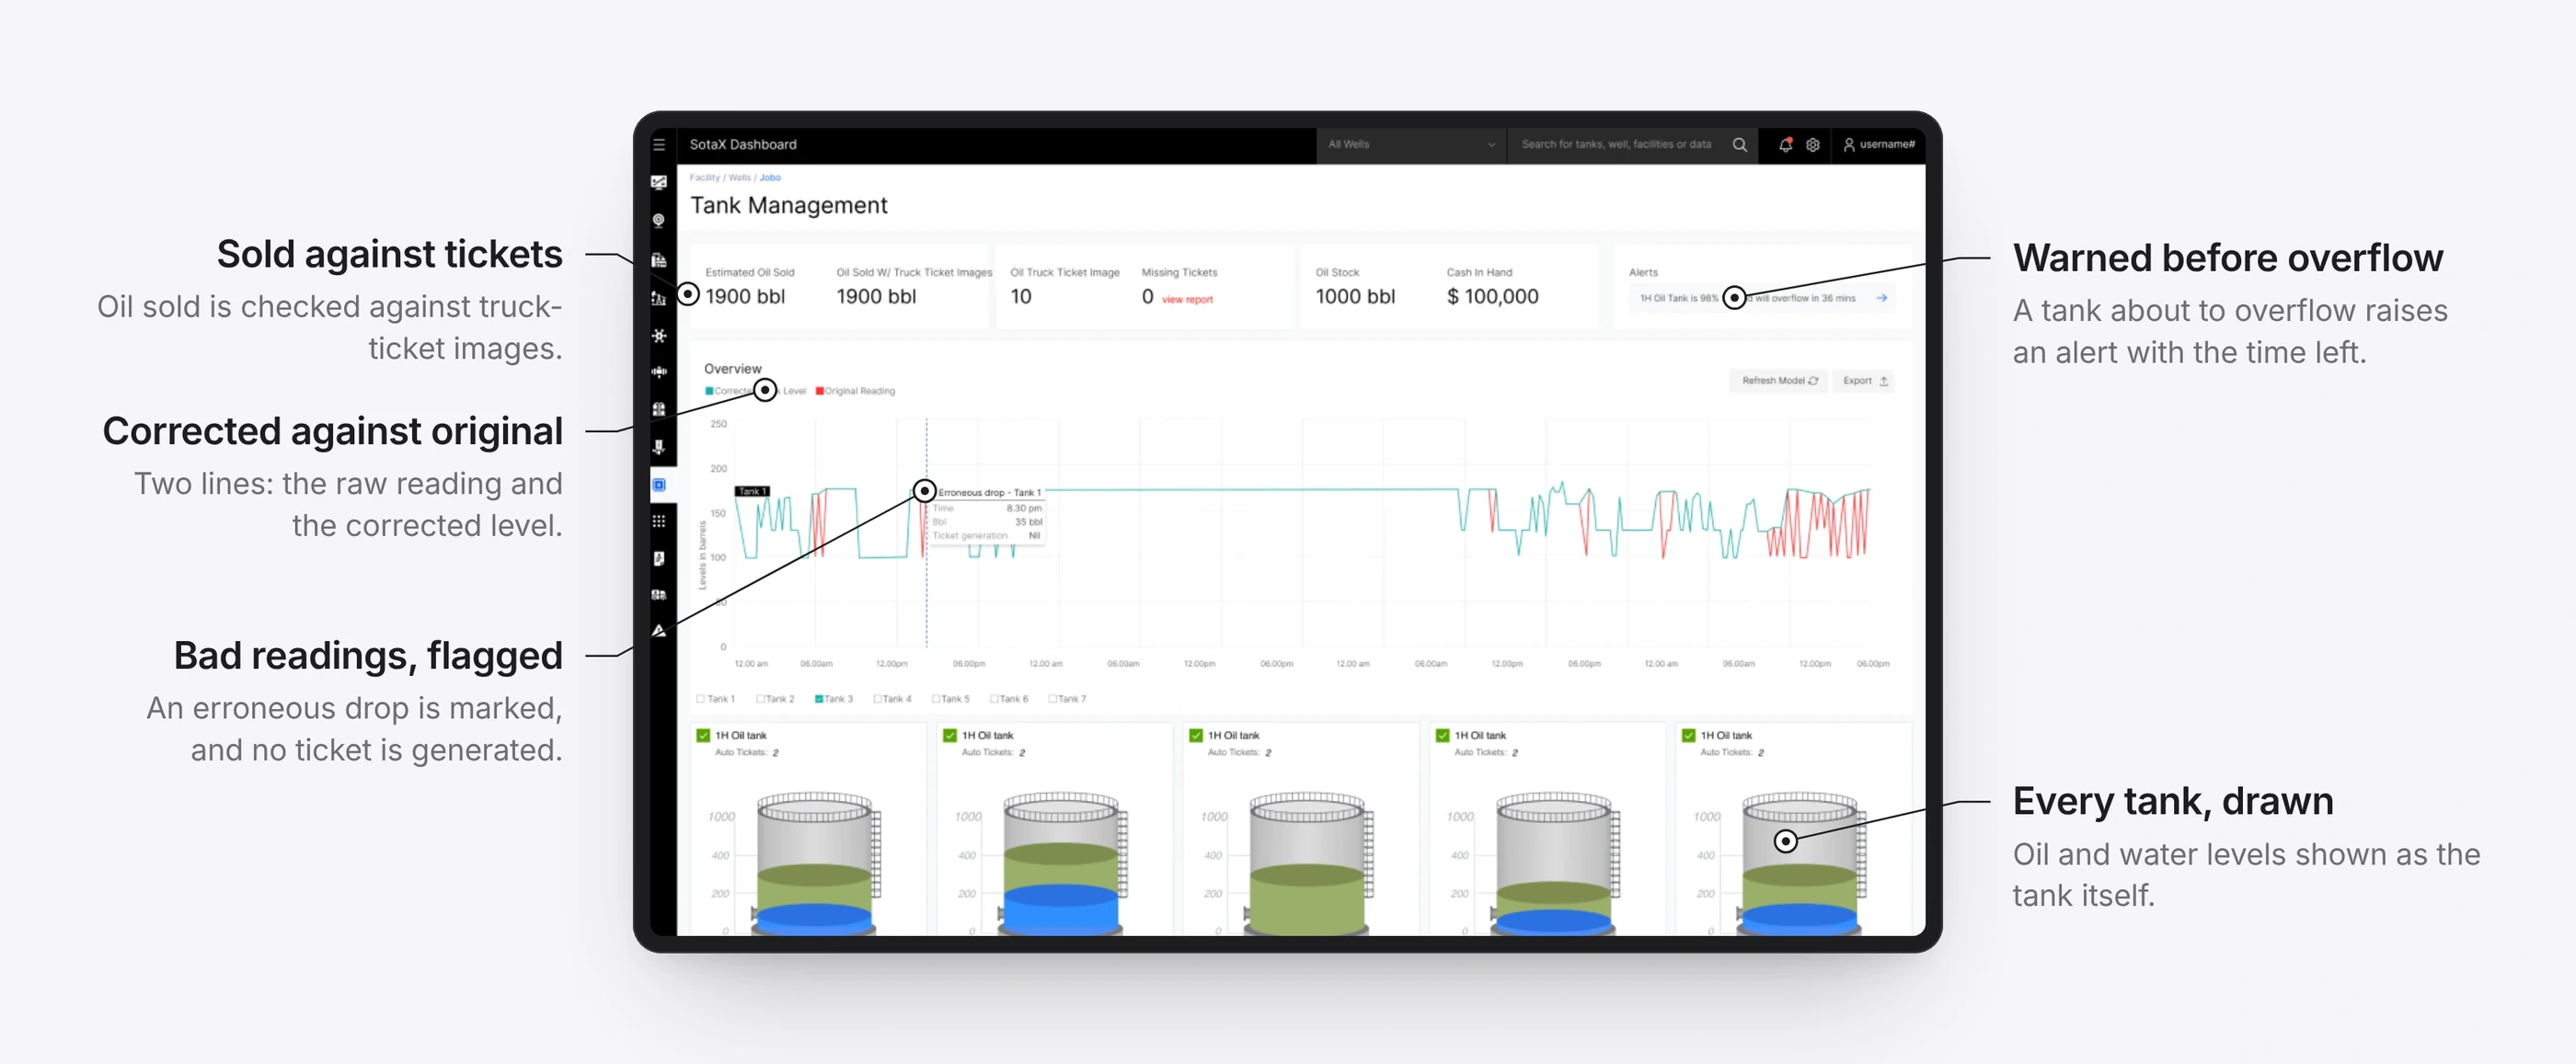
Production engineer
Was that oil really sold?
Before
Hold tank gauges against paper tickets by hand.
With SotaOG
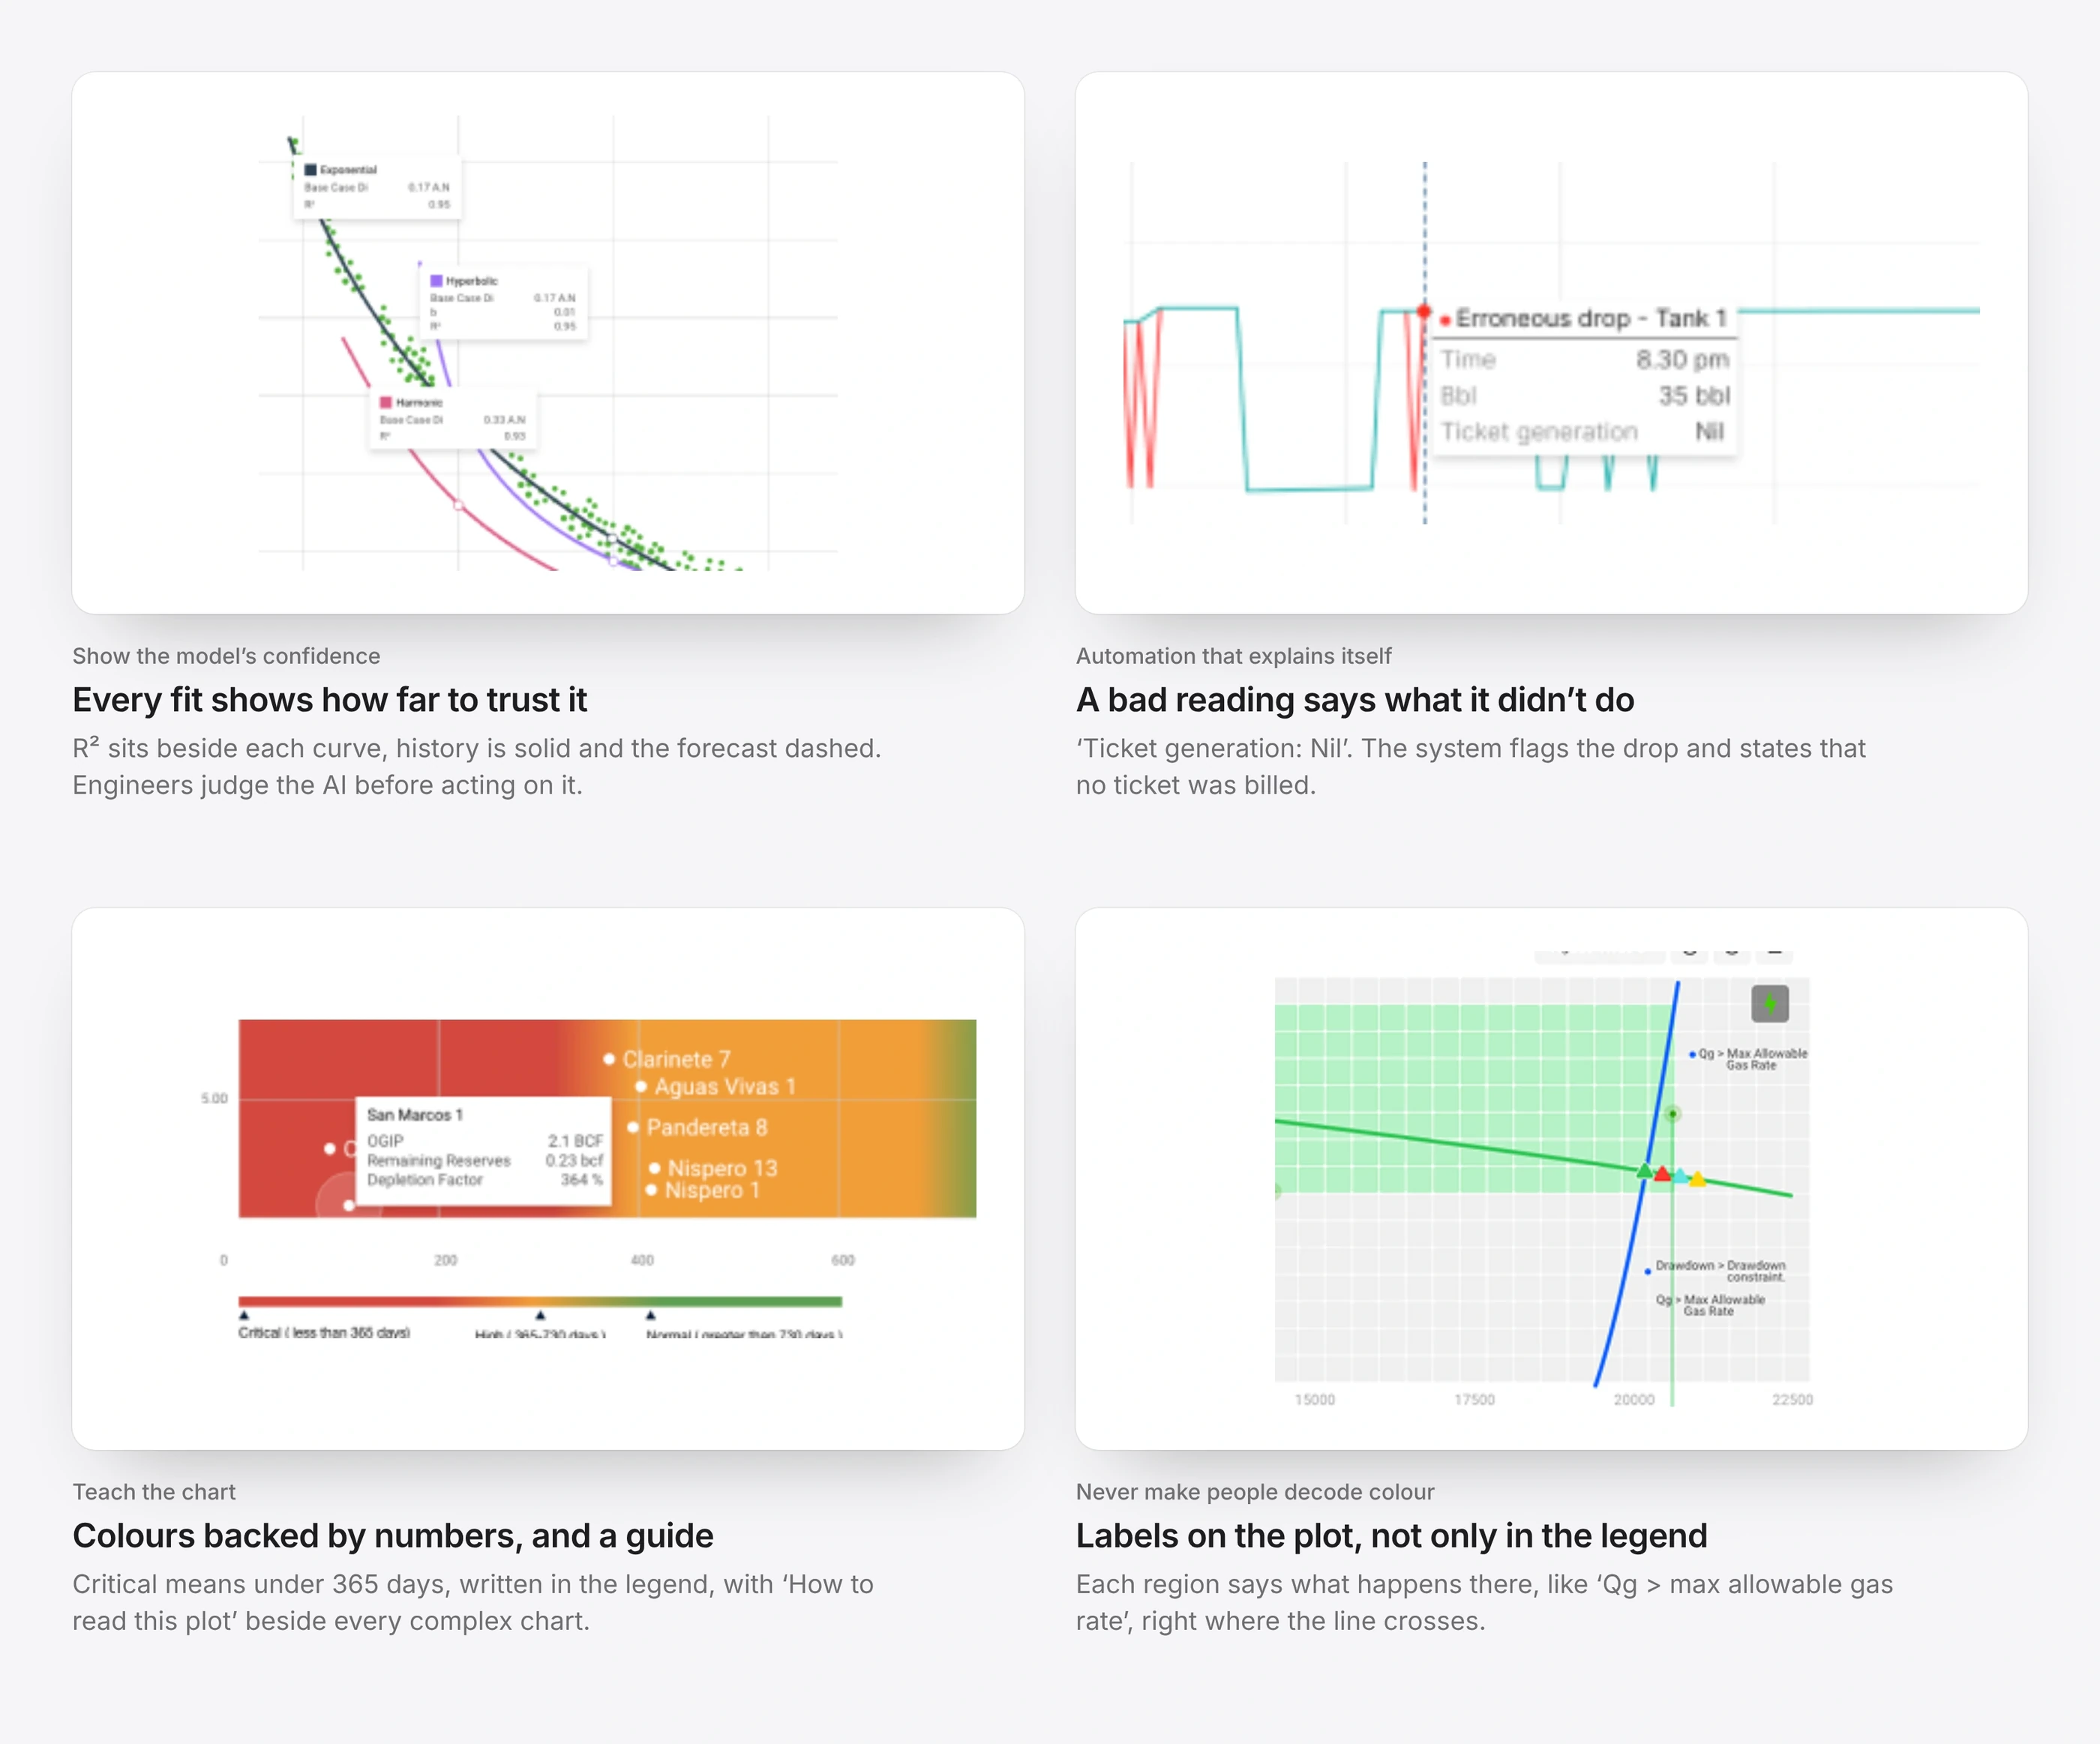
The tank chart flags the bad reading and states that no ticket was billed for it.
4
Field technician
Where is the faulty sensor?
Before
Trace a flat SCADA schematic, then walk the site to find it.
With SotaOG
The digital twin pins the tank with its live readings, and the alert is ranked by severity.
5
Revenue accountant
Can we close the month?
Before
Match tickets to run statements one by one, often long after the fact.
With SotaOG
Auto ticket, ticket image and run statement sit on one row, and the gap is fixed in place.
6
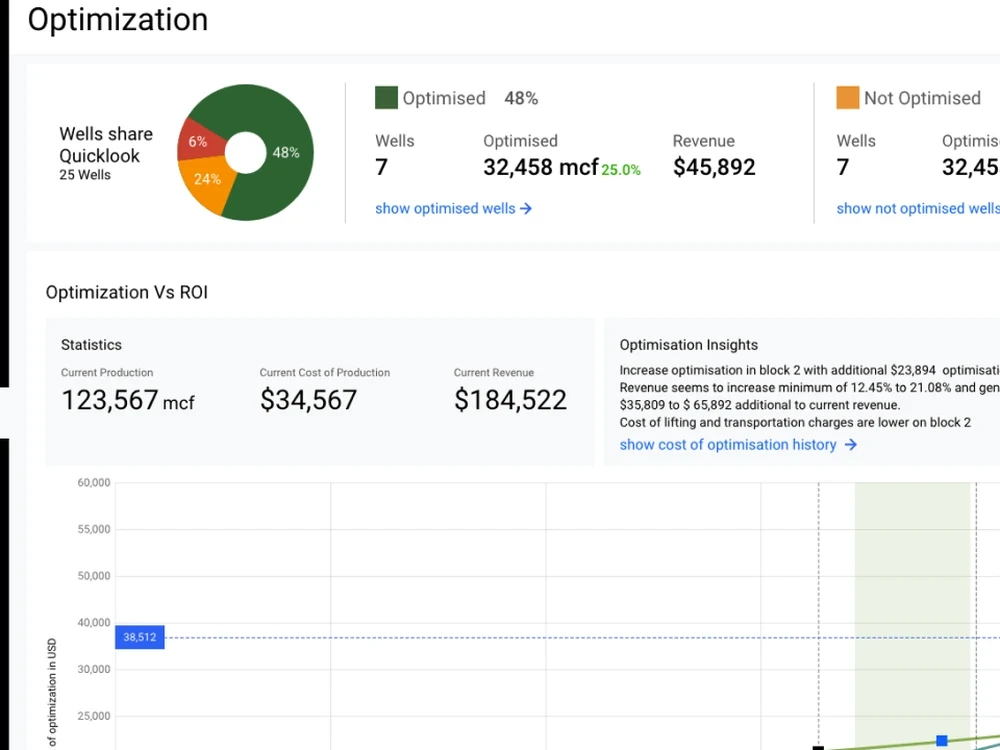
Finance lead
What will we earn?
Before
Forecast in a separate finance system, blind to what happened in the field.
With SotaOG
Forecasts run on the same, now-clean data, with each model’s fit shown beside it.
Before SCADA, paper tickets, spreadsheets and a separate finance system, each holding part of the truth.With SotaOG One record the whole team works from, from the first alert to the forecast.
Getting the twin right
It took four versions. Each one fixed what the last one got wrong, and I modelled the final facility in Blender and built it in Three.js myself, because the team had no Three.js developer.
From a flat plan to the real site.
Across the platform
The same rules ran through every view: the summary first, colour only for state, and detail on hover. These are the screens operators, engineers and finance leads used every day.
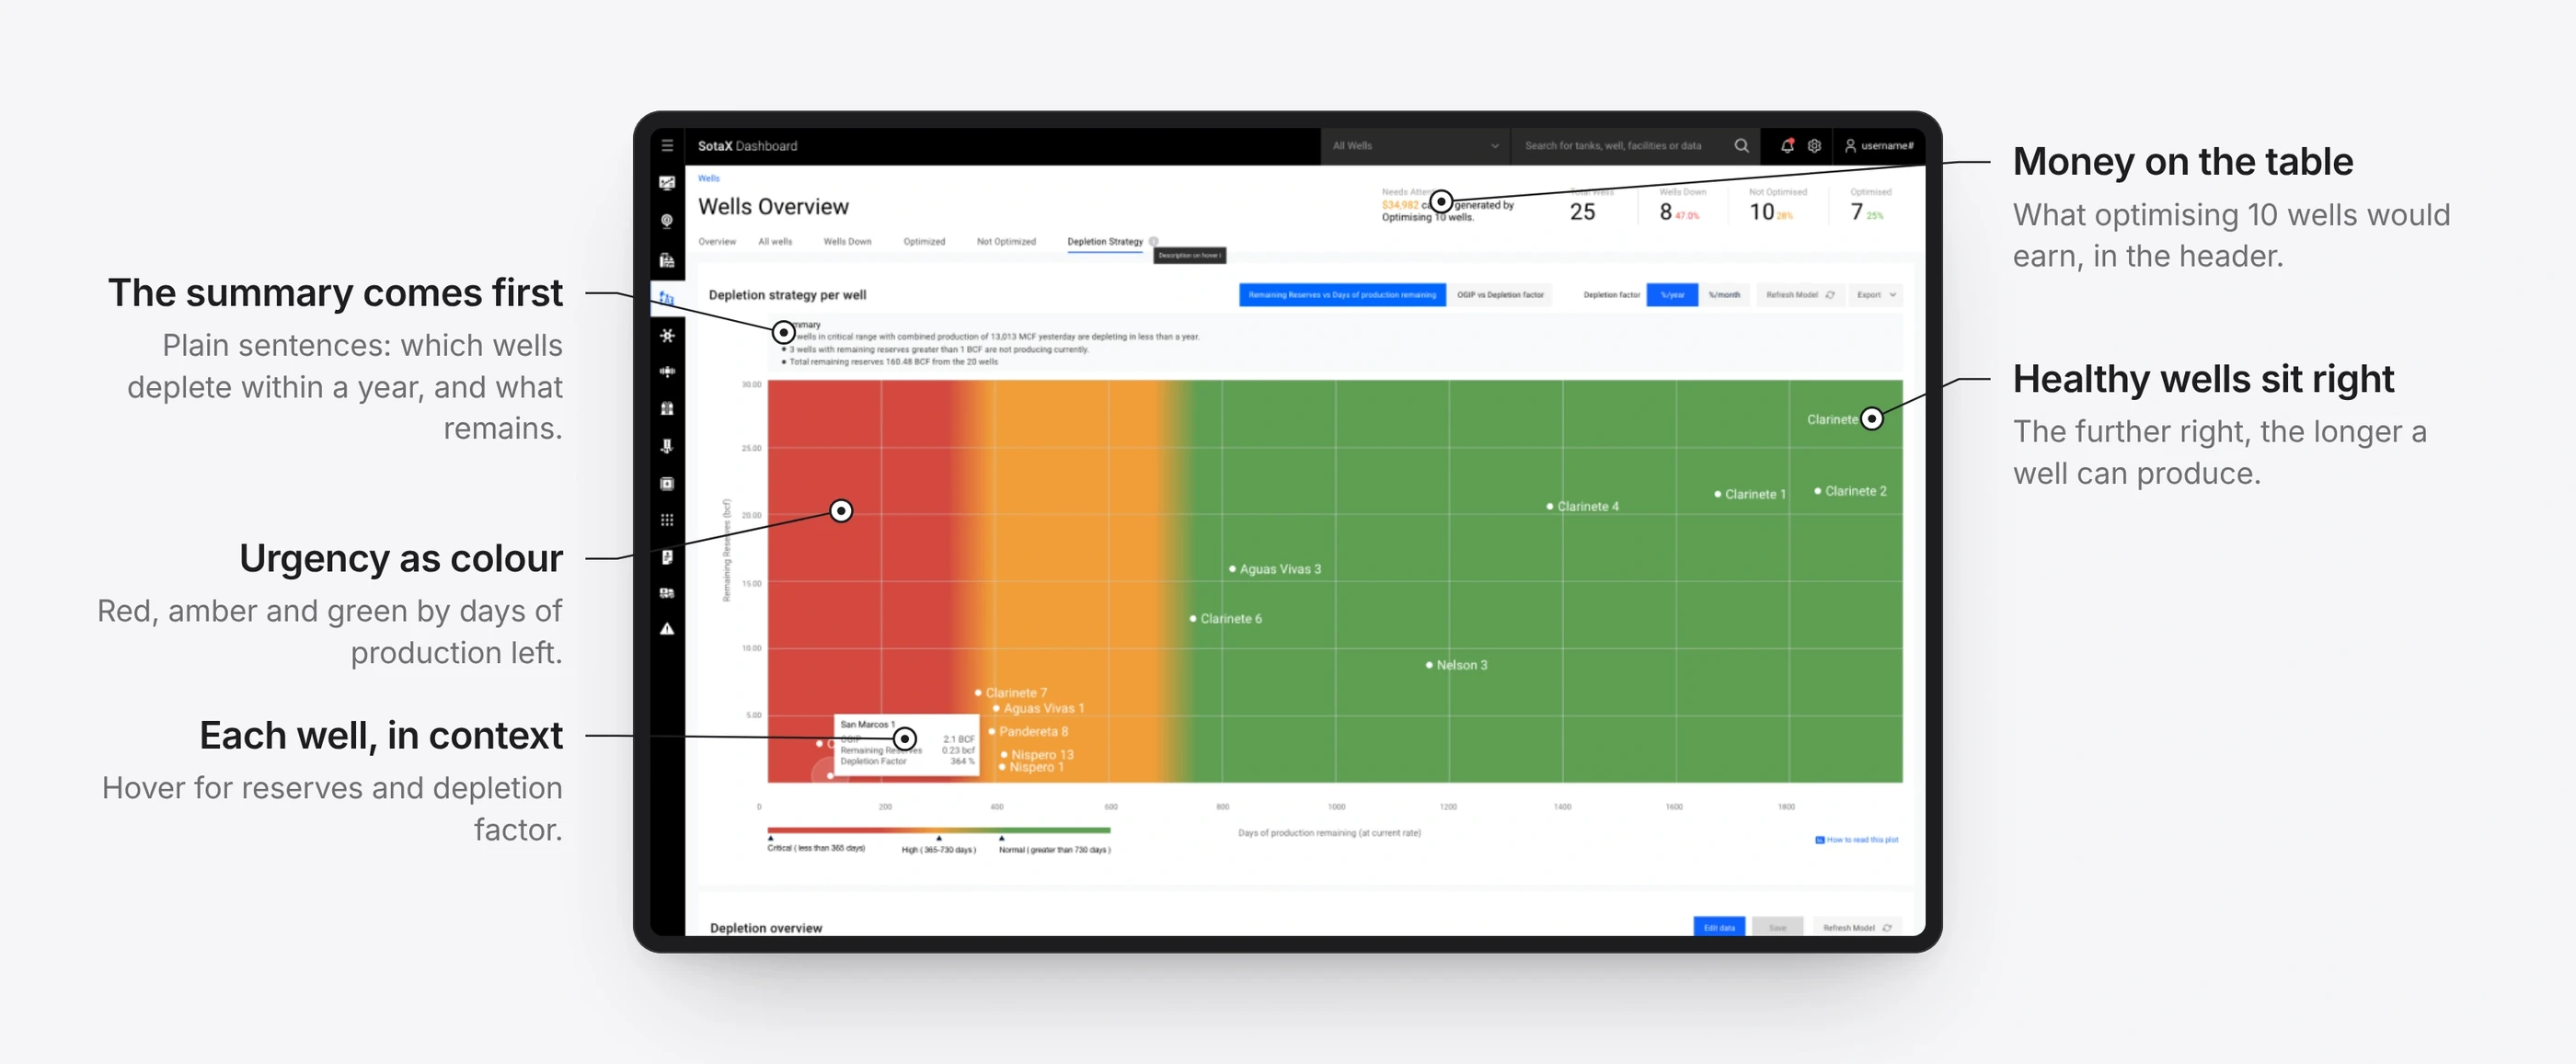
Which wells are running out, and how soon.
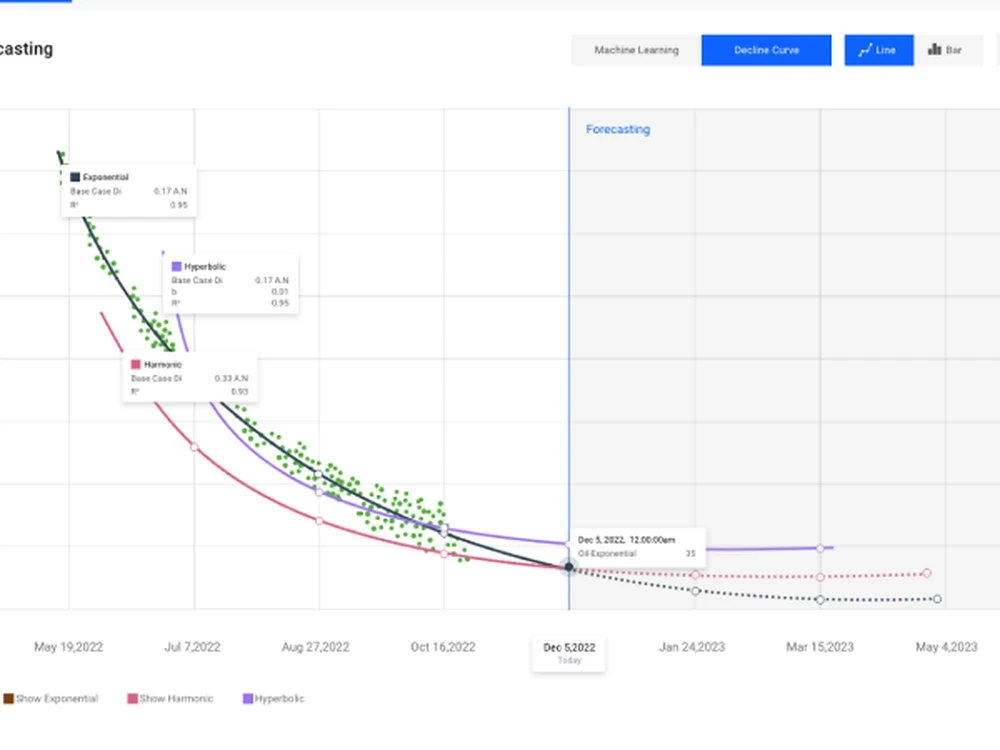
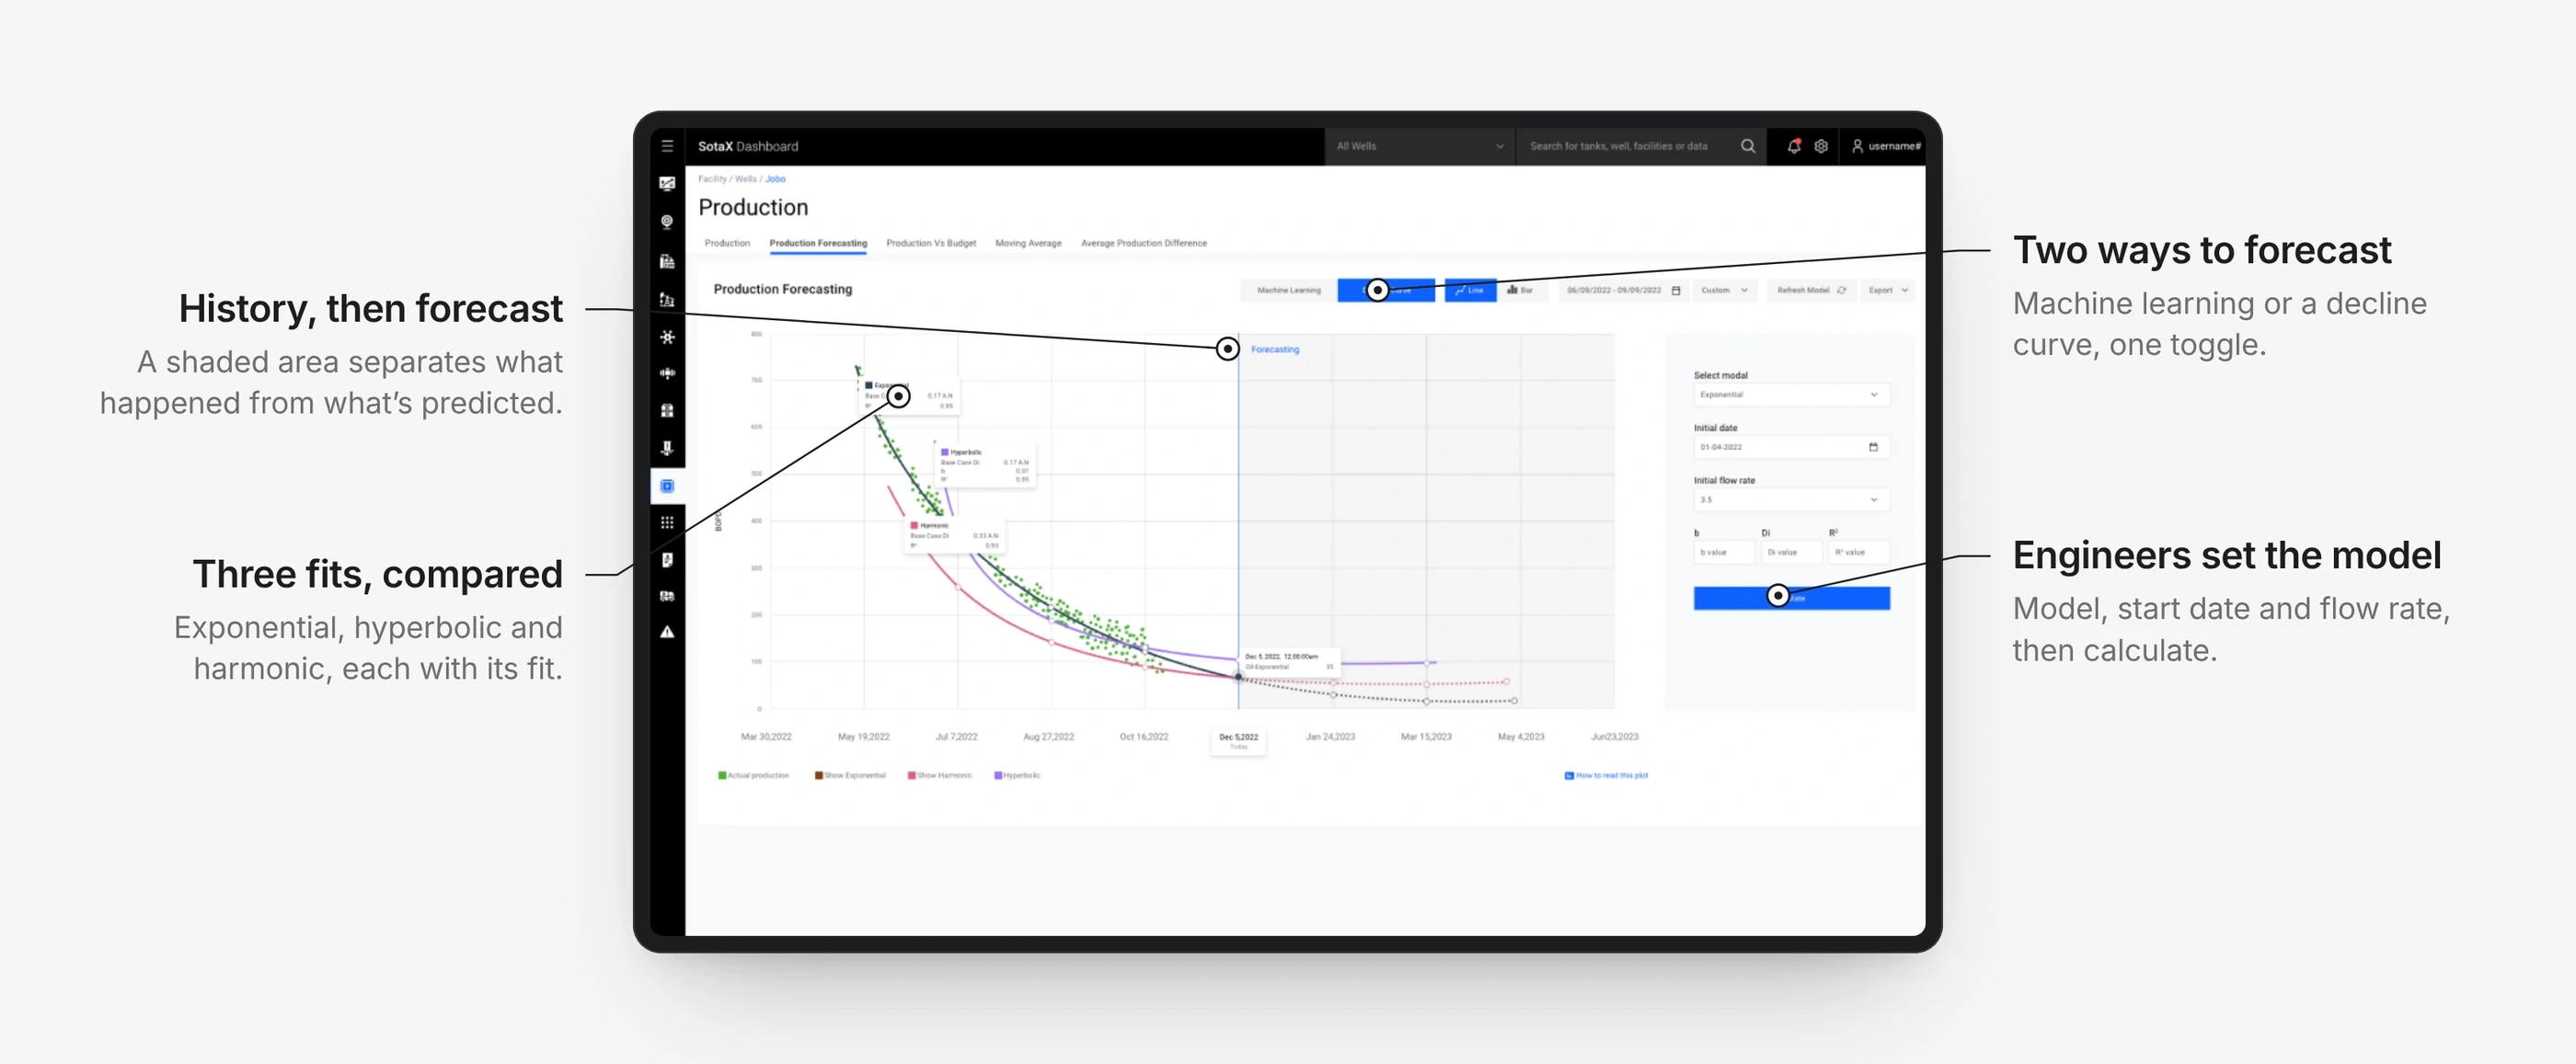
Forecasting production, with the model in the engineer’s hands.
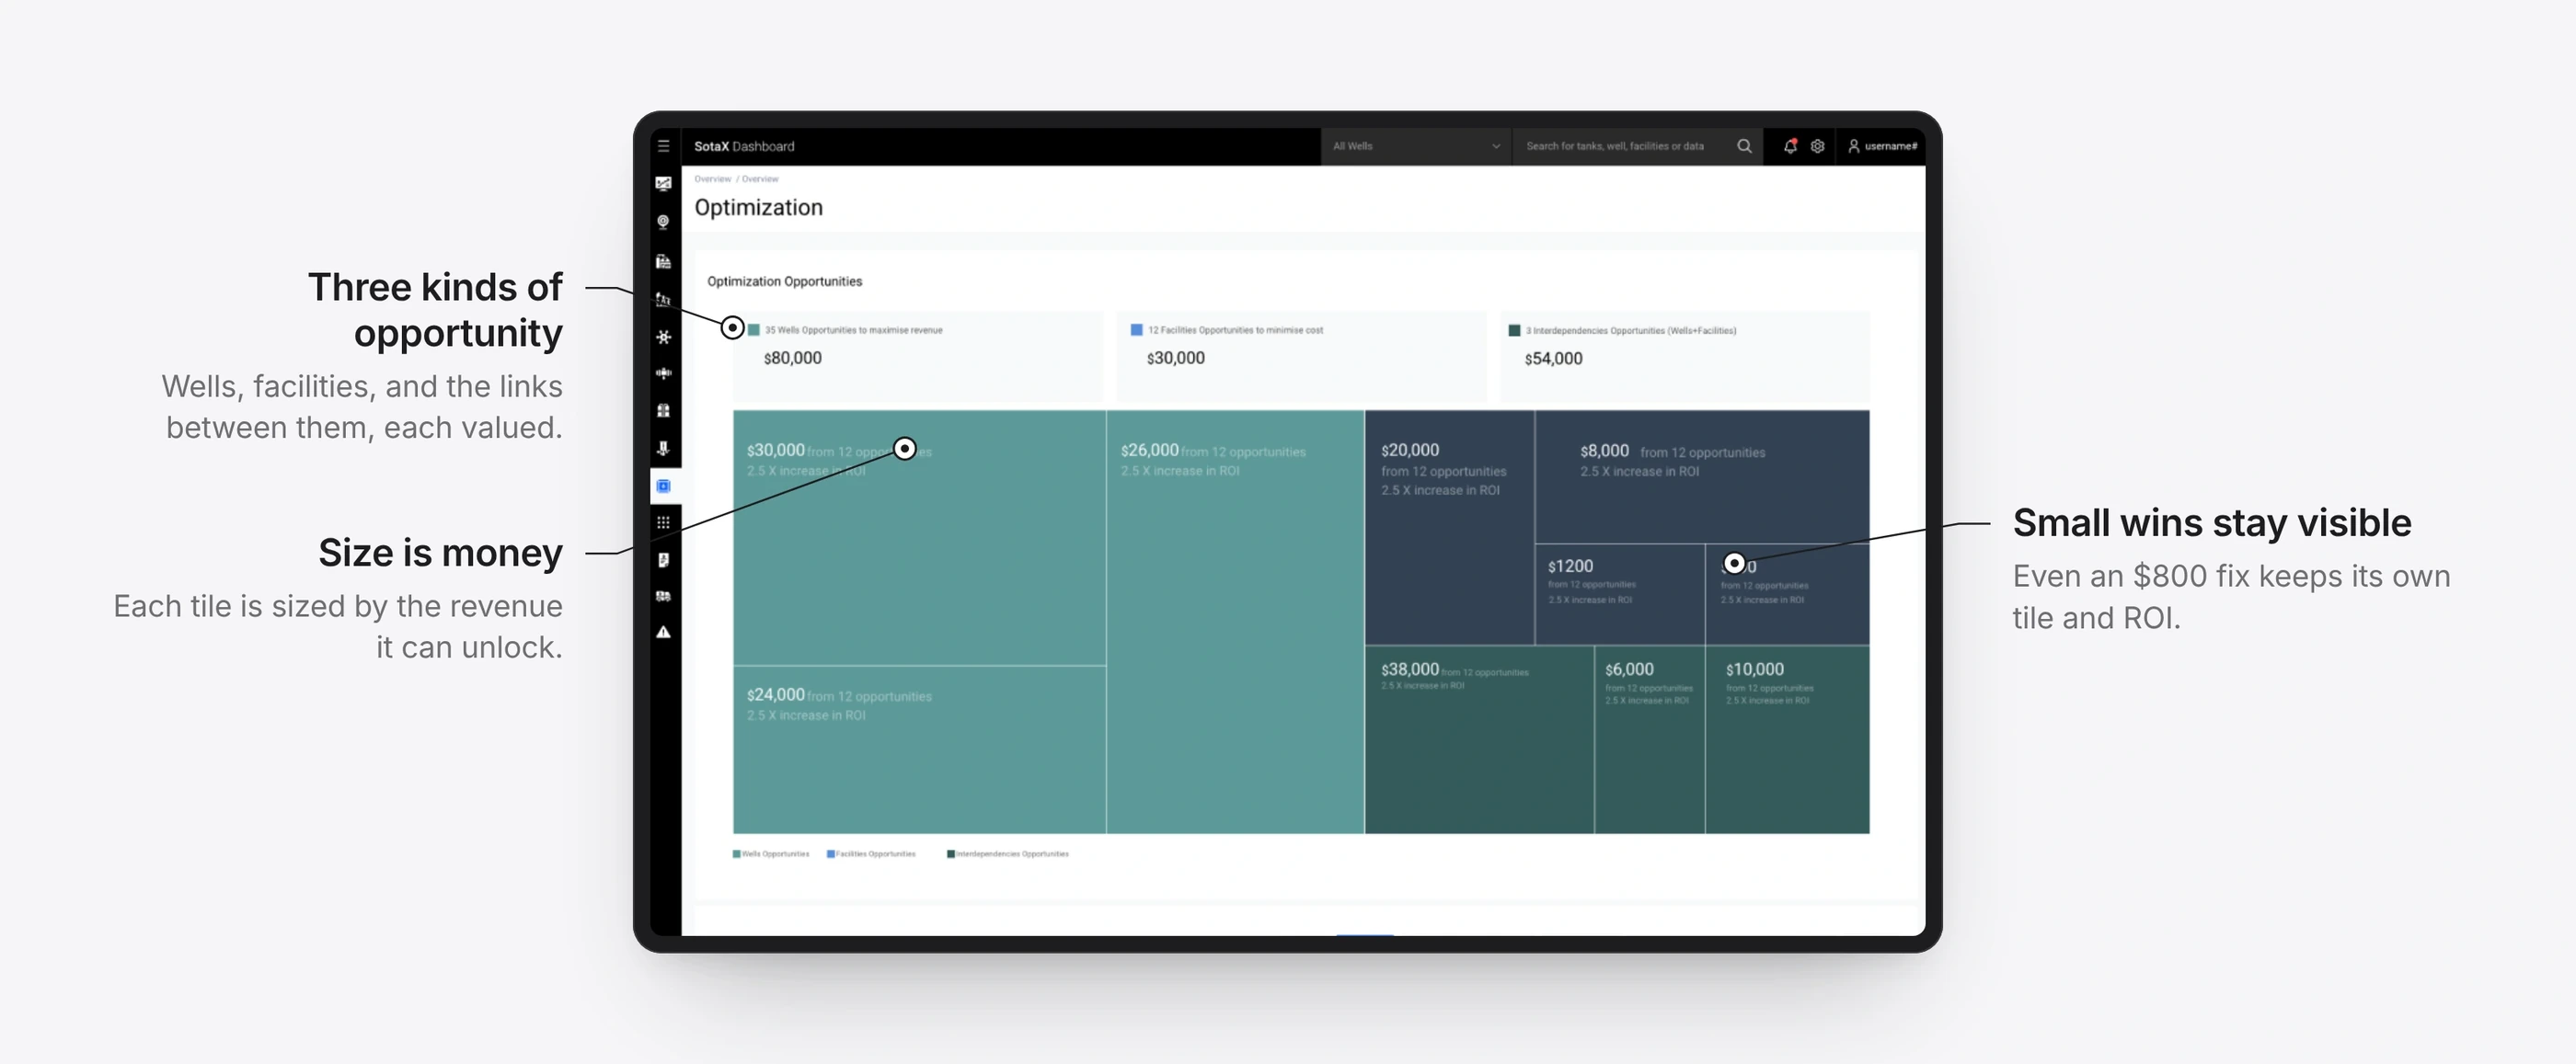
Where the money is, sized by value.
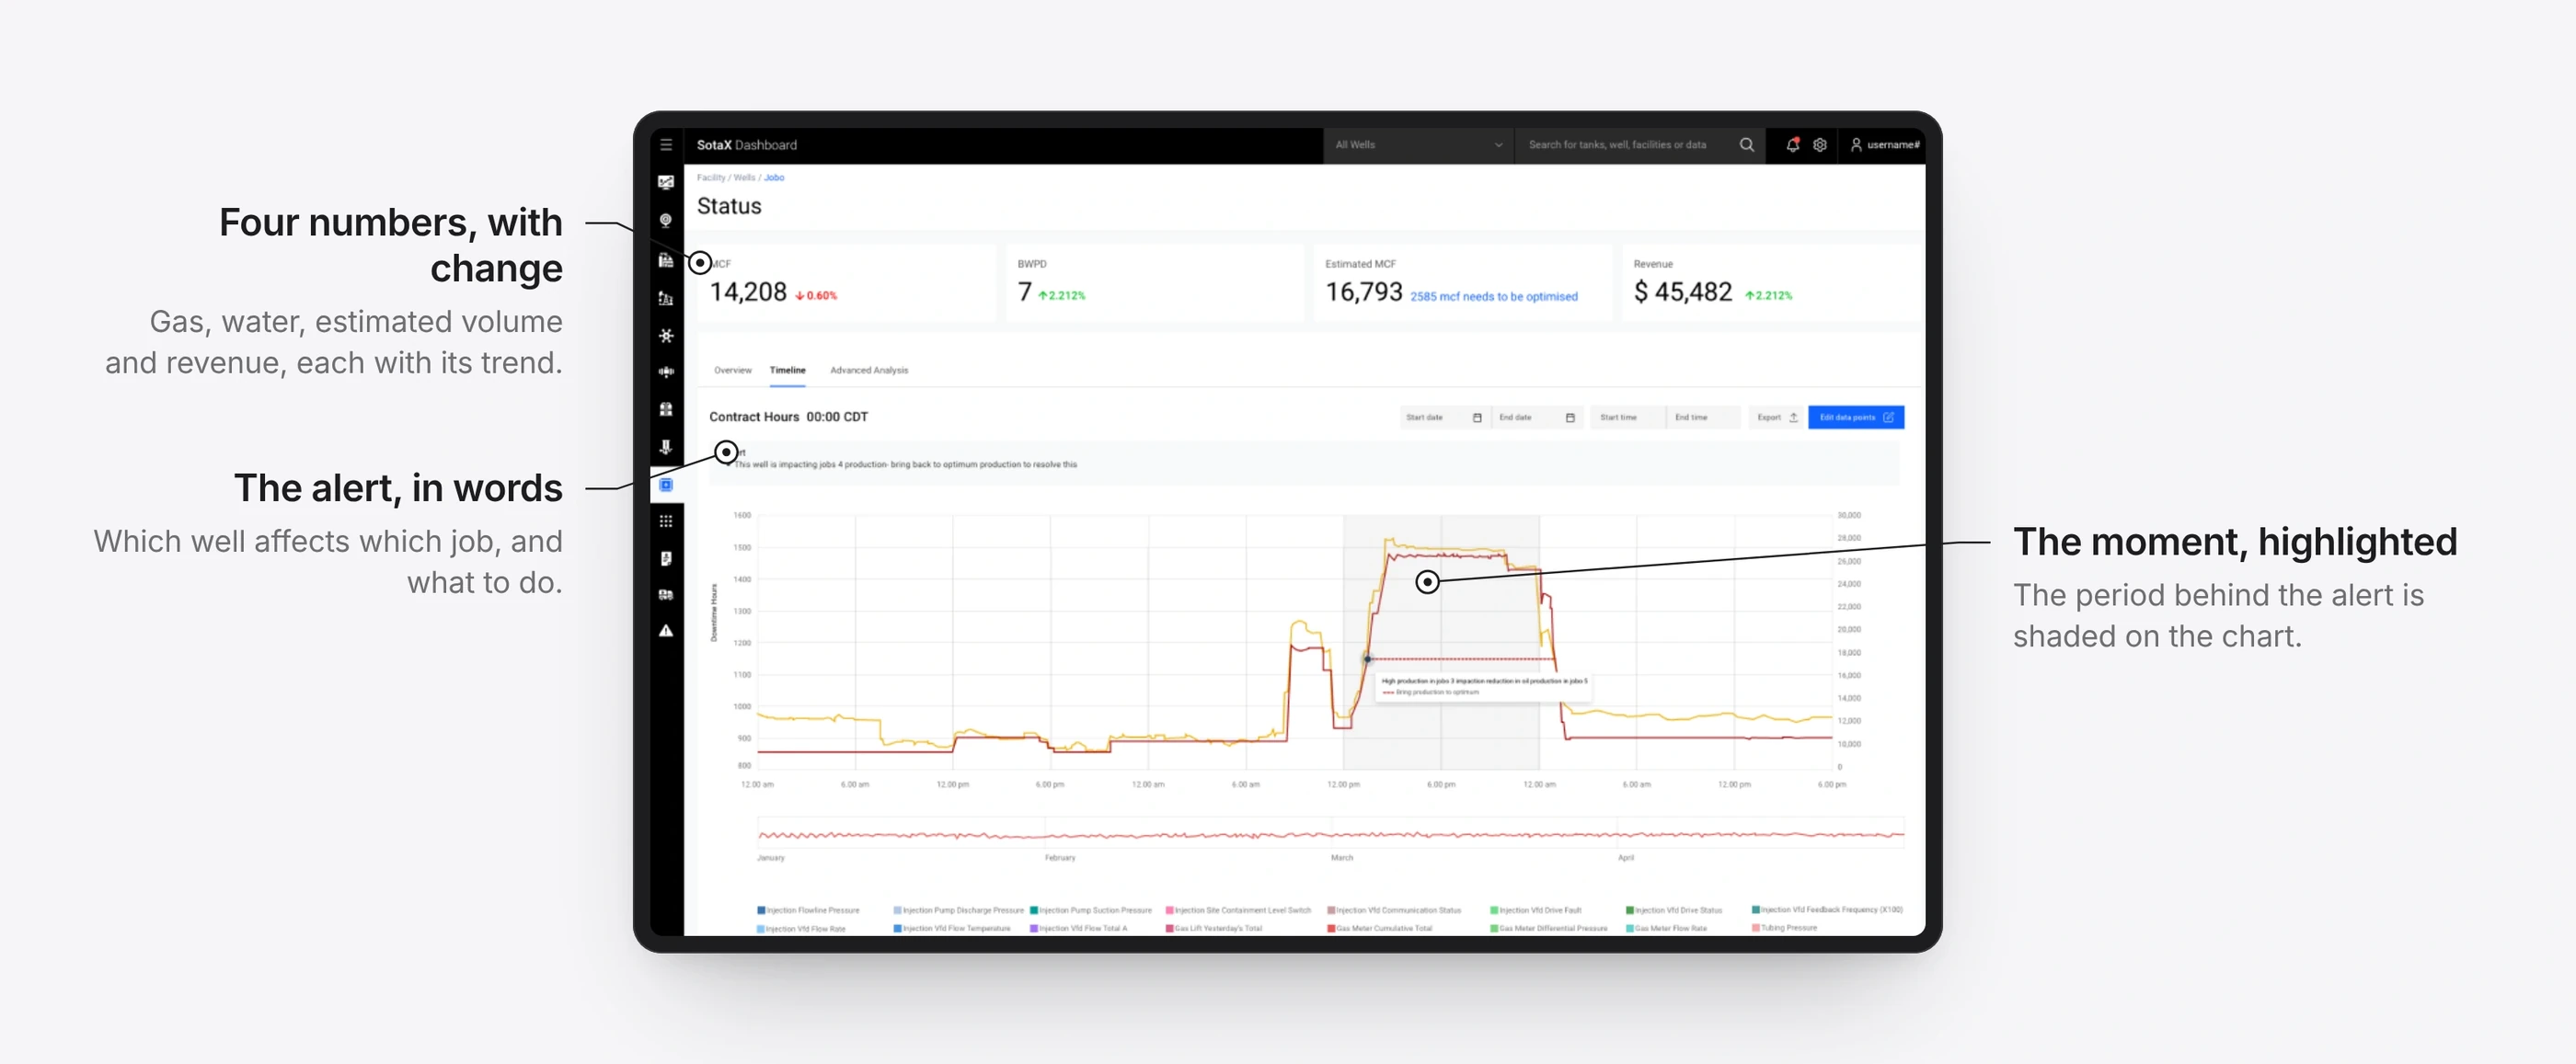
A well’s day, with the alert explained.
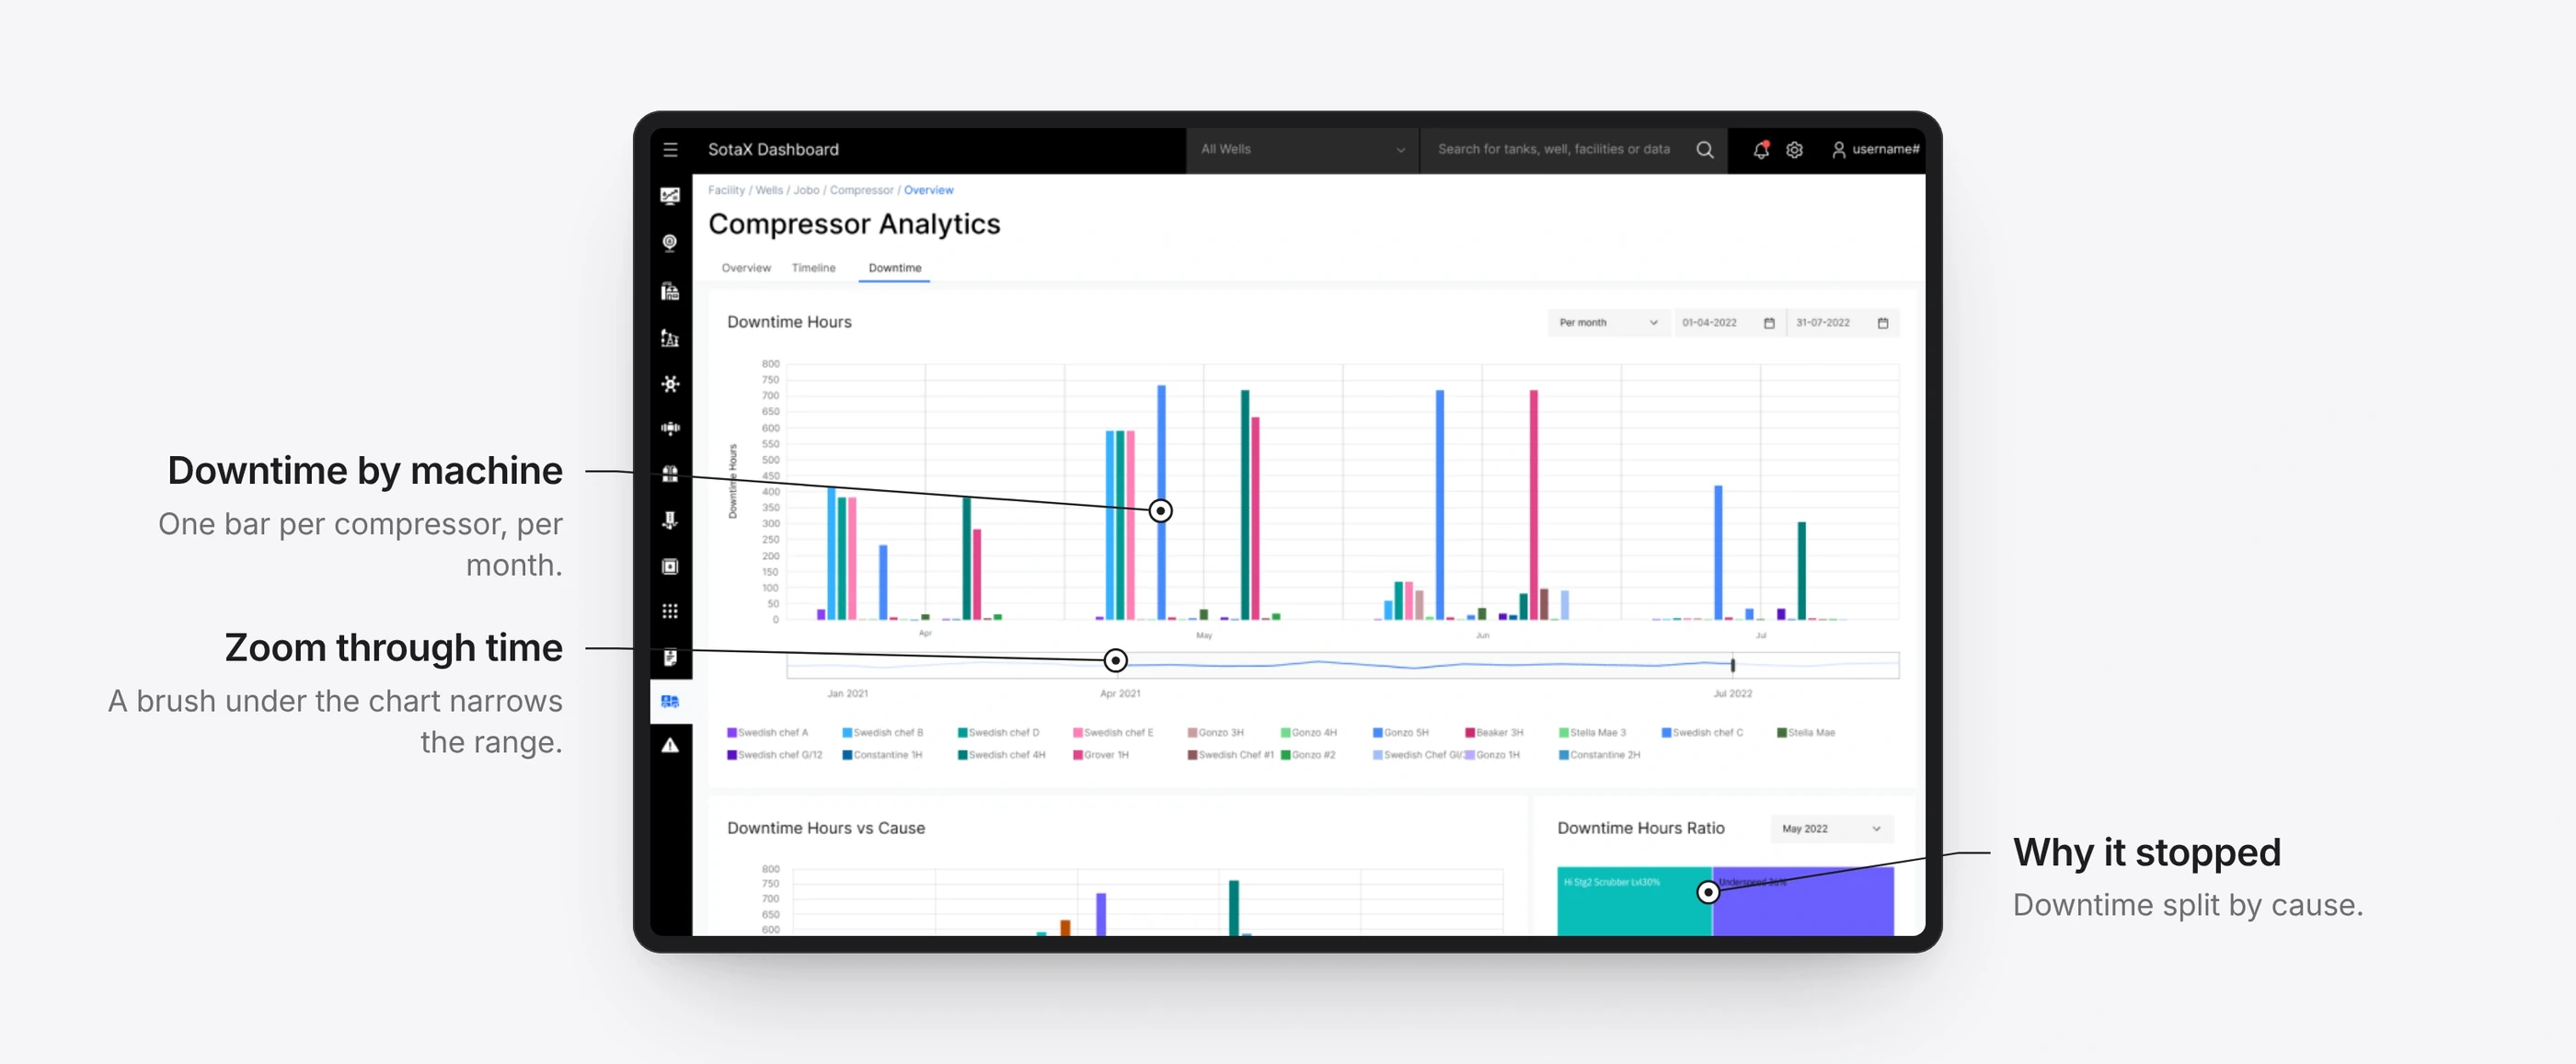
Downtime by compressor, and why.
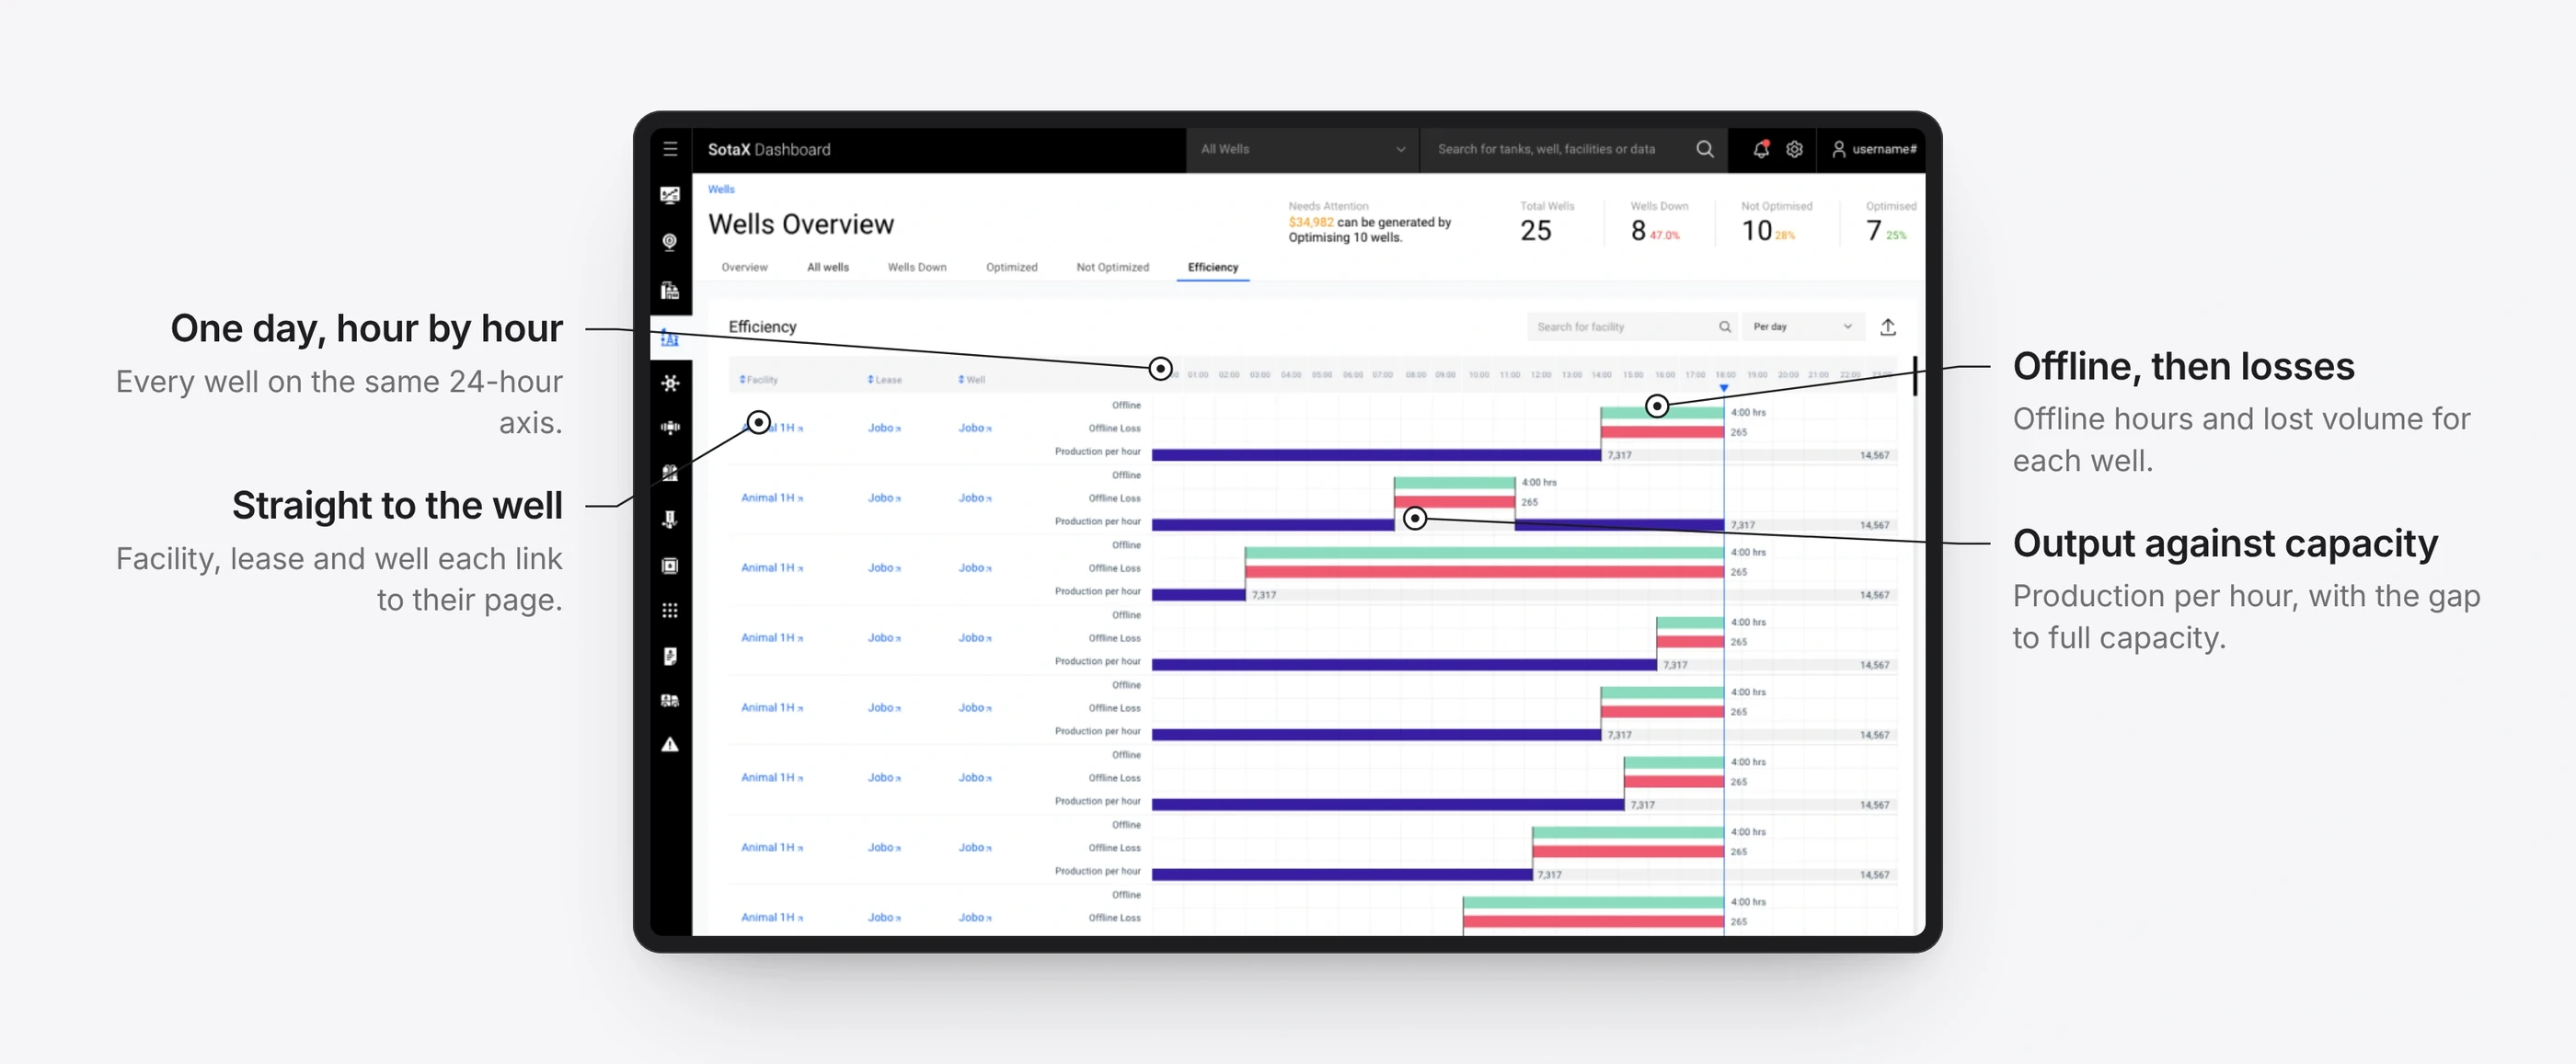
Every well, hour by hour.
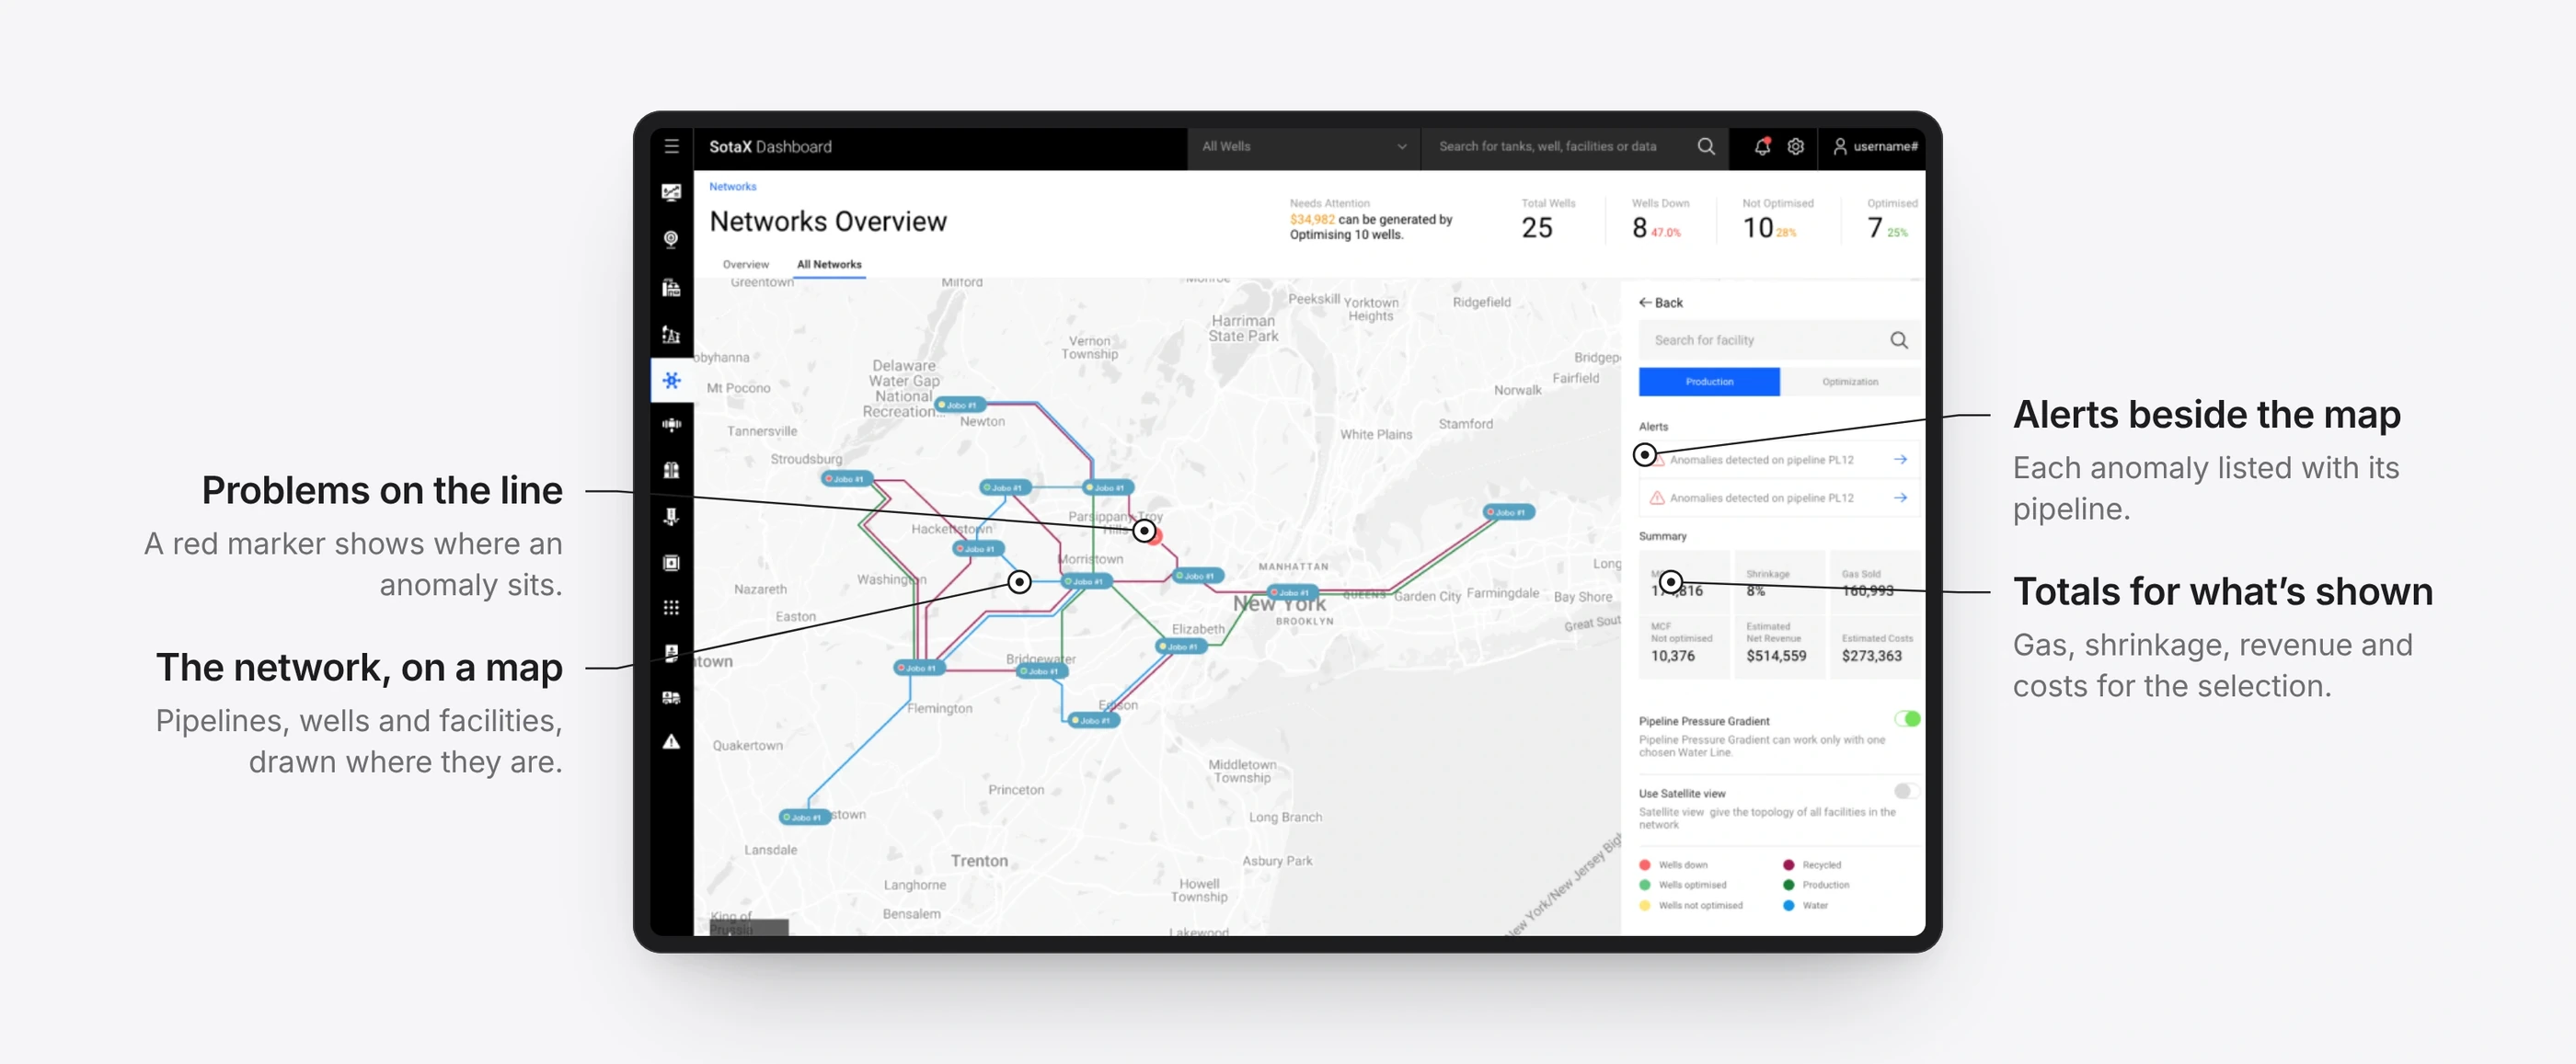
The pipeline network, with its alerts.
1 / 7
Details that did the work
Operators, engineers and finance leads only act on data they trust. These details earn that trust.
Minimal isn’t always clear
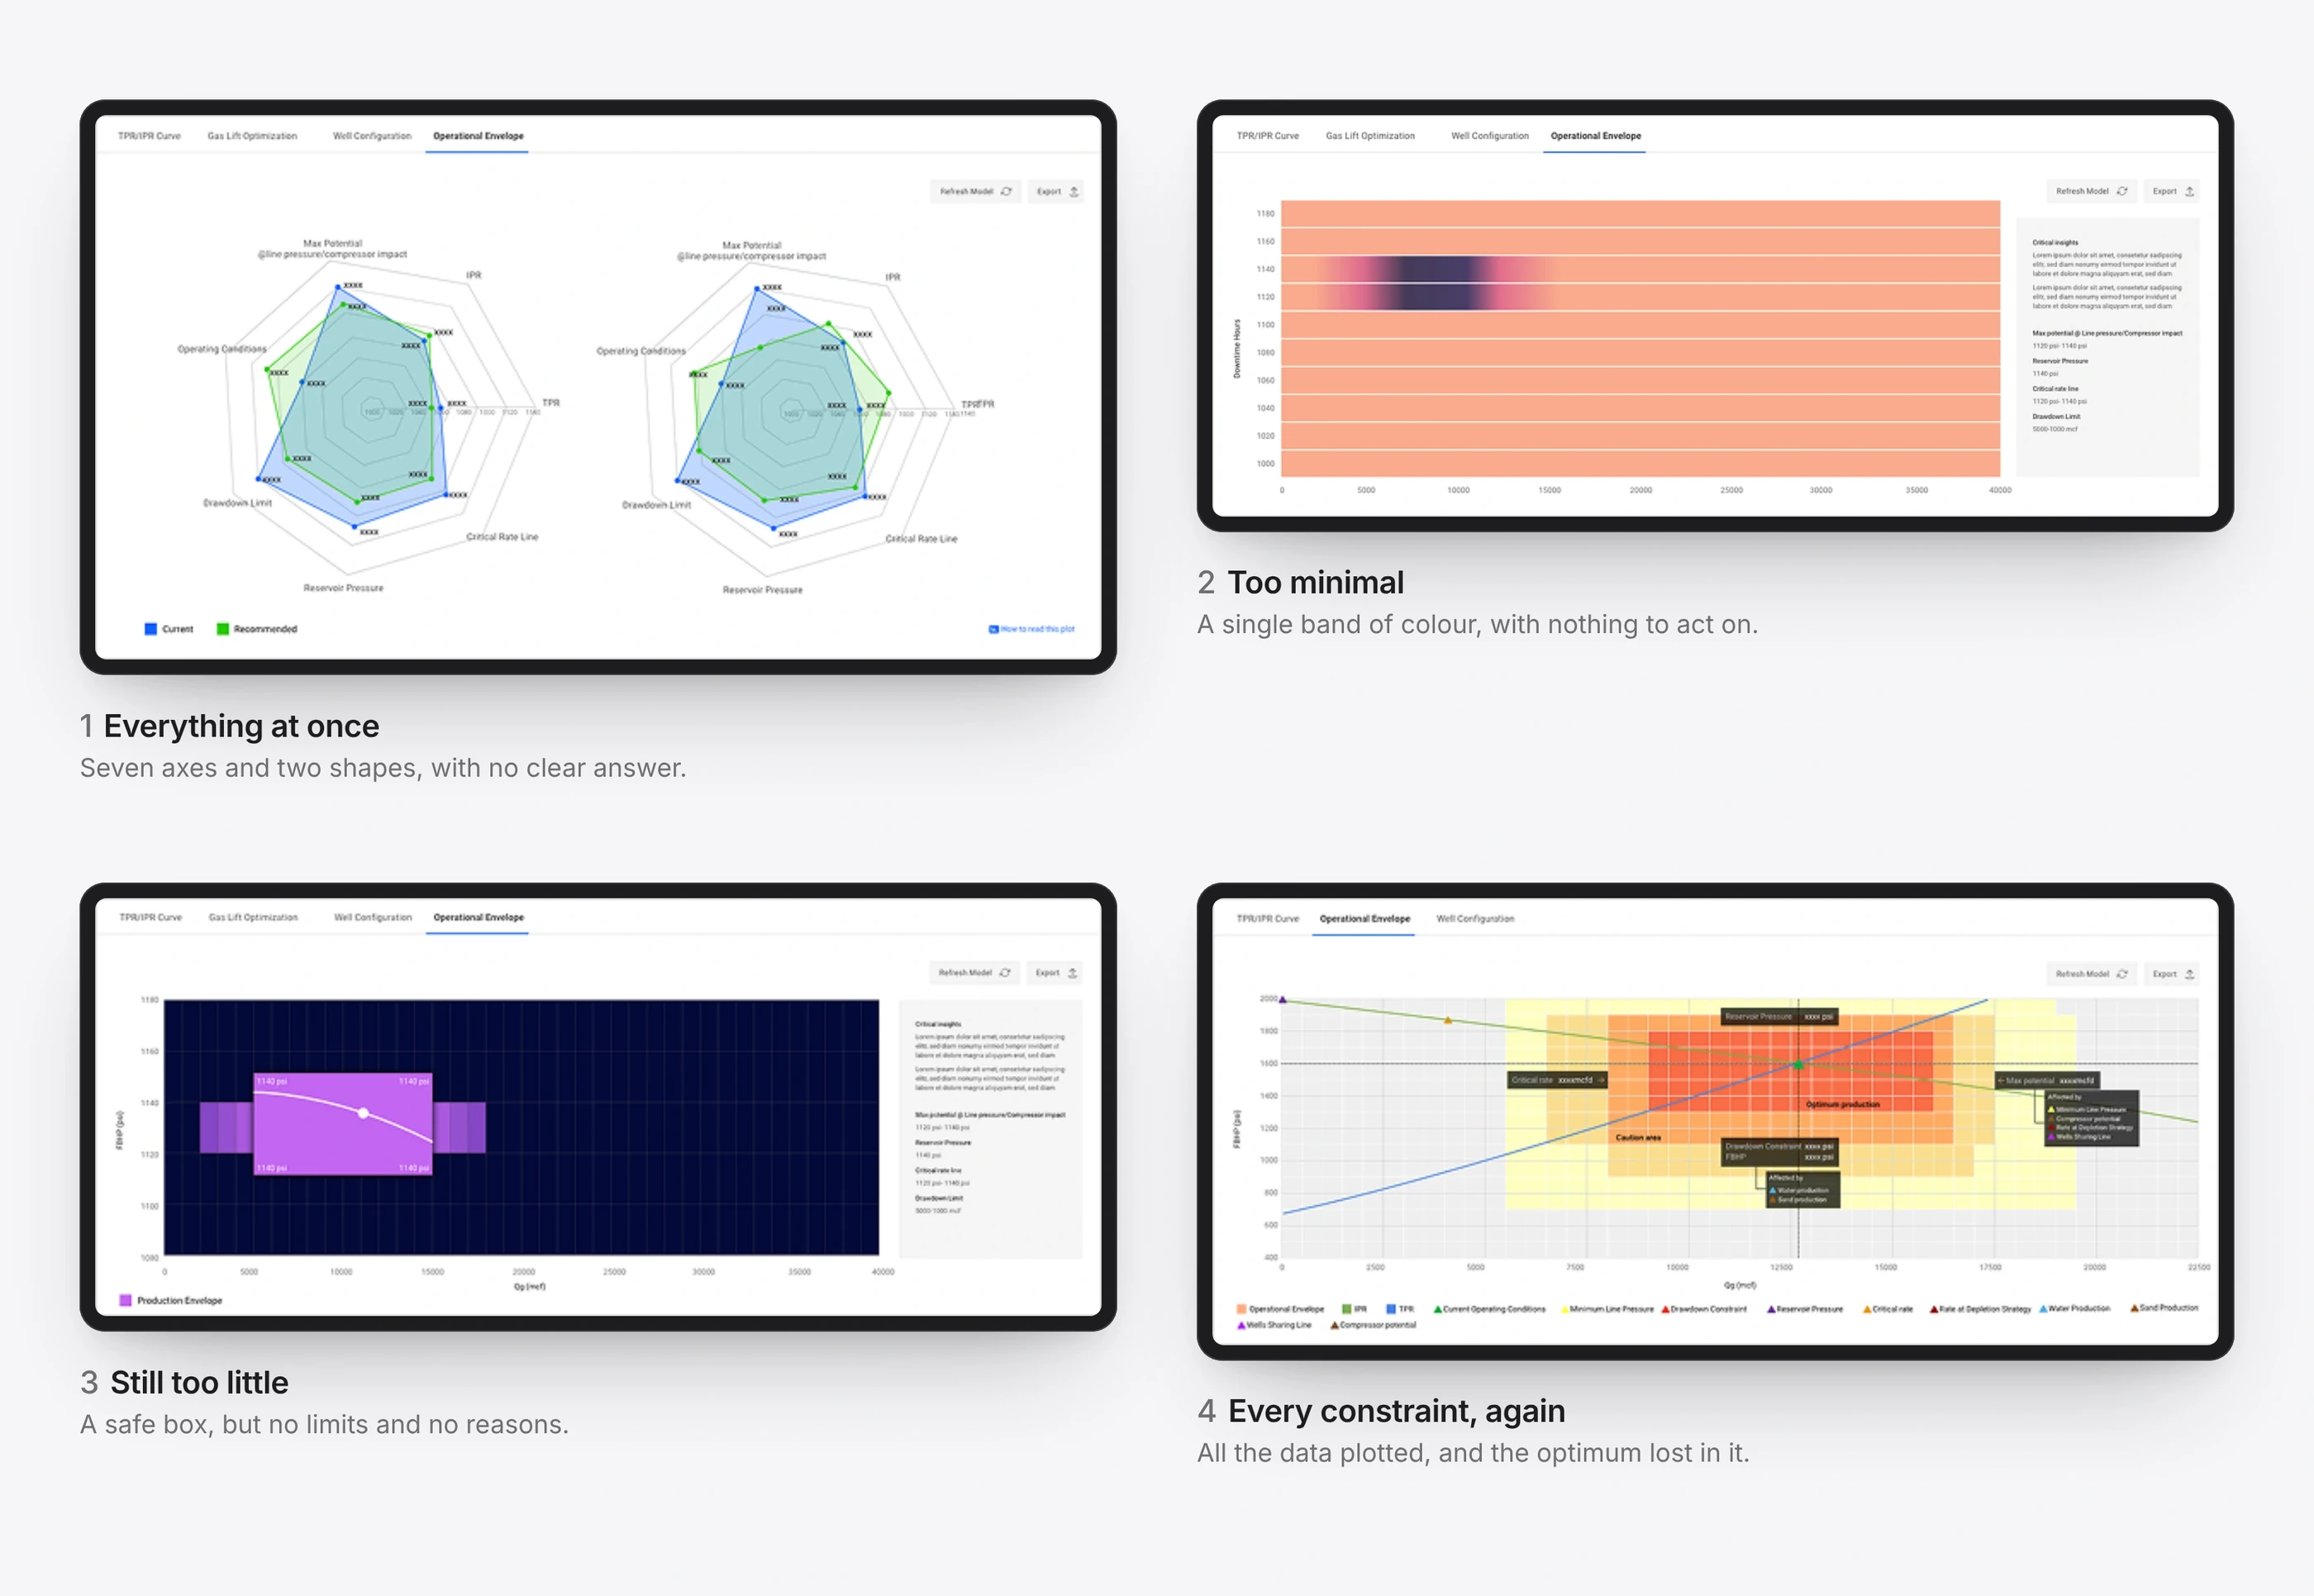
The operational envelope shows the range in which a well runs most efficiently under many limits at once. My first plots either showed everything or stripped so much away that nothing could be acted on. Working through the data with the team, we found that only a few variables decide the answer.
In complex domains, clarity means the right depth, not the least.
Four attempts that didn’t work.
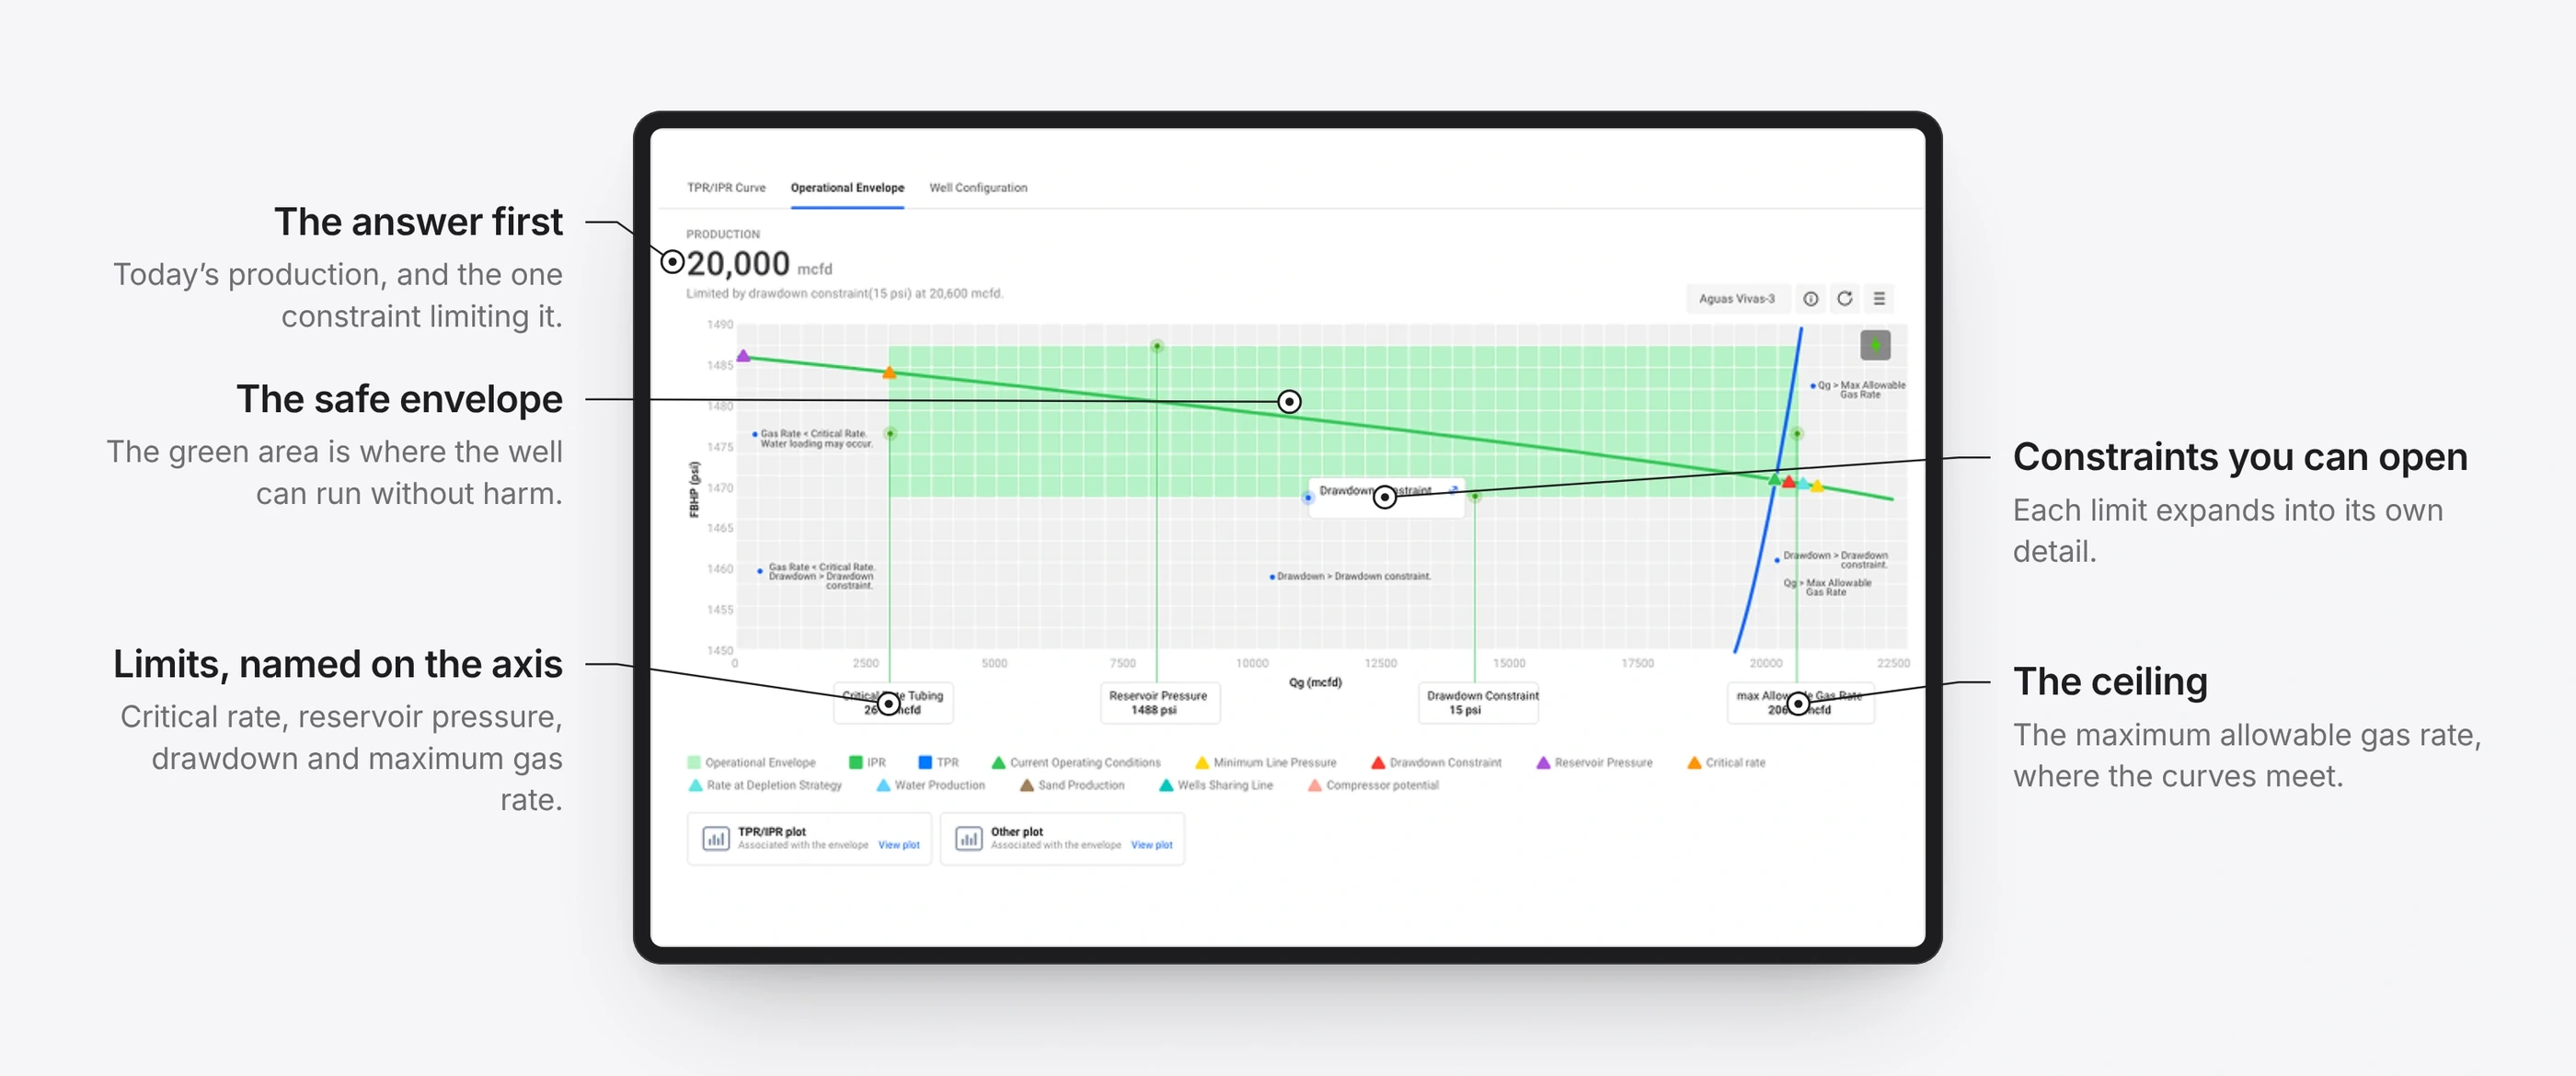
The final plot answers one question first: how much the well can produce, and what is holding it back. Everything else supports that answer.
The plot that did.The plot in use.
1 / 2
What people said
Technicians found issues faster.
Finance leads trusted their cash-flow predictions more.
Management saw shorter decision cycles and fewer surprises.
Reflection
In oil and gas, design isn’t decoration. It is clarity, reliability and precision under pressure.
This project shaped how I think about enterprise data. The platform later extended to manufacturing and ESG reporting.